11 Feb A Comparison of Domestic and European Demands and Positional Differences in Elite Soccer
Introduction
Soccer is an intermittent field-based sport which requires various bouts of high intensity movements throughout gameplay.
On average, soccer players cover 8-13km during the course of a match [1]. Previous research has analysed high-intensity running activity during match-play [2].
This research found that, on average, wide midfielders or wingers complete the most high-intensity running distance (>19.8km/h or 5.5m/s). It was also found that attackers completed the highest sprint distance (>25.2km/h or 7m/s) when compared to other positions.
When looking at the number of sprints, central midfielders led the way with central defenders a close second. In regard to explosive distance, on average, attackers covered more than other positions [3].
Currently, no research has analysed the physical demands of elite-level Domestic competition soccer (DC) in comparison to European competition soccer (EC).
The objective of this insight is to display a comparison of the positional differences for various metrics in Domestic & Europa League Group Stage soccer.
Methods
Match data was collected using 10Hz GNSS devices (Apex, STATSports) and analysed through the company’s proprietary software application, Sonra 3.0.
Data was collected from 6 domestic (League of Ireland & FAI Cup) matches and 6 Europa League Group Stage matches. Players had to play 90 minutes to be eligible for inclusion in the study.
Five primary positions were identified: Centre Backs (CB), Full Backs (FB), Central Midfielders (CM), Wingers (W) & Strikers (ST). The physical metrics chosen for analysis were Total Distance, High Speed Running (HSR) Distance & Explosive Distance.
Relative zones were used for player-specific running data. Relative zones were calculated by each player performing a maximum speed sprint test over 40m.
HSR Distance was calculated as any distance covered above 55% of each players’ max speed. Explosive Distance is defined as the distance performed by a player when their metabolic power is above a threshold of 25.5 W/Kg, and below the HSR threshold.
The mean values for each position and metric were first calculated. A Box Plot was then used to display and compare the mean and range values between the two competitions.
Results
The results varied across each of the positions and physical metrics. These results will be explained below.

Figure 1. Total Distance Comparison between Domestic & European Soccer
CM covered the most Total Distance in both DC and in EC. On average, each position except the ST covered more Total Distance domestically.
FB covered roughly the same Total Distance in both DC and EC. In DC there was a wider variation of Total Distance covered, whereas in EC there was less variation across the squad.
The squad average for Total Distance in DC (10091m) is slightly higher compared to EC (10019m).

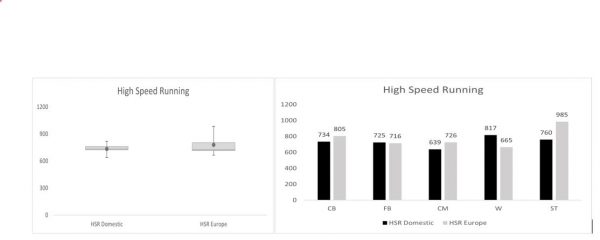
Figure 2. High-Speed Running Distance Comparison between Domestic & European Soccer
ST covered the most HSR Distance in EC while W led the way in DC. FB & W covered more HSR Distance in DC.
The squad average for HSR Distance is slightly higher in EC (779m) when compared to DC (735m) and there is a wider variation in HSR Distance in EC when compared to DC.

Figure 3. Explosive Distance Comparison between Domestic & European Soccer
CM completed the highest amount of Explosive Distance in both competitions. The squad average for Explosive Distance is slightly higher in EC (1369m) compared to DC (1334m).
There is a greater variation of Explosive Distance completed in DC compared to EC.
Discussion
There are many similarities in the physical demands between Domestic & European competition. CM completed the most Total Distance than any other position due to the box-to-box nature of their role.
A possible reason for greater variation in Total Distance for DC may be due to the team having more possession and covering varying distances. There were some differences in HSR Distance.
ST completed the most HSR Distance in EC, while W completed the most in DC. This supported previous research showing that W complete the most HSR distance in DC [2].
However, this finding is not consistent with the results from EC and may be due to having less possession and less opportunities to transition against stronger opposition faced in European fixtures.
Contradicting research indicates HSR Distance is higher when a team obtains less possession in a game [5]. CM covered the most Explosive Distance in both competitions due to the stop-start nature of their position.
The reason for higher Explosive Distance in EC may relate to lower possession and the players quickly accelerating/decelerating to close down an opposition player to win the ball back.
The squad average is greater for high-intensity activities in Europe, but Total Distance is higher domestically. This may show that European soccer is played at a higher intensity when compared to Domestic soccer.
This insight displays a comparison of the demands of domestic & European elite-level soccer. Differences may be attributed to the style of play and higher-level of opponent seen in European competition as opposed to Domestic opposition.
References
- Reilly, T. and Williams, A., 2003. Science and Soccer. London: Routledge, pp.59-72.
- Bloomfield, J., Polman, R. and O’Donoghue, P., 2007. Physical Demands of Different Positions in FA Premier League Soccer. Journal of Sports Science and Medicine, 6(1), pp.63-70.
- Tierney, P., Young, A., Clarke, N. and Duncan, M., 2016. Match play demands of 11 versus 11 professional football using Global Positioning System tracking: Variations across common playing formations. Human Movement Science, 49, pp.1-8.
- Di Salvo, V. et al., 2010. Sprinting analysis of elite soccer players during European Champions League and UEFA Cup matches. Journal of Sports Sciences, 28(14), pp.1489–1494.
- Bradley, P., Carling, C., Archer, D., Roberts, J., Dodds, A., Di Mascio, M., Paul, D., Gomez Diaz, A., Peart, D. and Krustrup, P., 2011. The effect of playing formation on high-intensity running and technical profiles in English FA Premier League soccer matches. Journal of Sports Sciences, 29(8), pp.821-830.
Author Details
Adam Fox
Sports Scientist – Account Manager