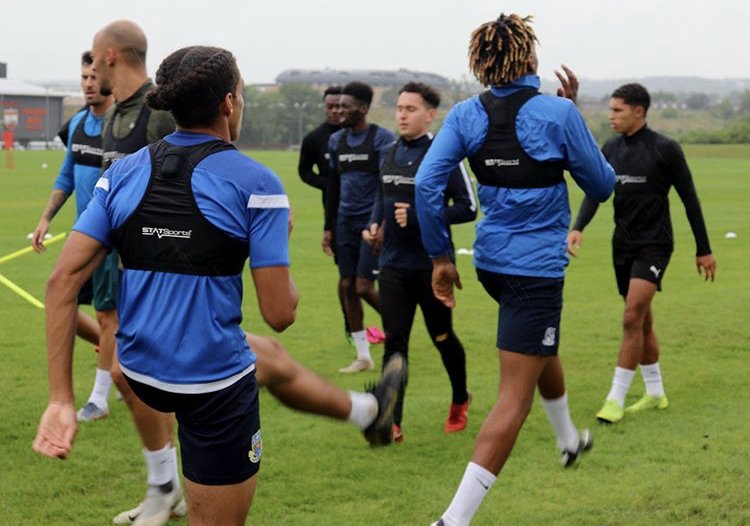
10 Jun A Comparison of the Peak Game Demands of Elite Competitive Matchplay in Under 19 and First Team Soccer
Introduction
In recent years, the practice of quantifying the Peak Game Demands (PGD) across all footballing codes has been prevalent in elite/sub-elite team sports.
When practitioners analyse the most intense period of play from competitive action, it allows them to develop training drills to ensure that their players are exposed to these demands during the training week.
These periods have been noted to occur at the most critical period of match-play (Whitehead et.al 2018). Hence, it is crucial that practitioners analyse and prepare their athletes for these events.
It is also essential for coaches and sport scientists to understand that the PGD may differ significantly among age groups, and that by exposing less physiologically developed athletes to PGD shaped by first team players, that it may lead to an increased injury risk.
The aim of this insight is to compare the PGD of competitive match-play between First Team and Academy (U19) soccer players. The author hypothesises that there will be significantly higher outputs for senior players relative to their underage counterparts.
Peak Game Demands/Max Intensity Periods
In a review of the literature, there are several methods deployed by practitioners to extract the PGD of match-play.
These methods include, but are not limited to; Segmental Analysis, Moving Averages, and Ball in Play Analysis.
Segmental Analysis involves splitting the activity into segments of a specified time to isolate the most demanding time period.
For example, nine five-minute segments of the first half and selecting the most demanding segment.
Calculating Moving Averages requires the analysis of the raw instantaneous data. This is a more accurate reflection of PGD than segmental analysis, as it will capture the fluctuations in demands that may be missed by using fixed-time windows.
However, this method would require personnel proficient in processing raw data and statistical software packages such as R.
Ball in Play analysis identifies the most prolonged period the ball was in action and extracts the physical demands for this period.
This facilitates the creation of drills for the max portion of time the team may be active for during match events. However, this requires the assistance of a video analyst to code every time the ball is in play which can be time consuming.
It is possible to perform each of the aforementioned methods using the Sonra software, including any analysis of raw data.
As eluded to above however, some of the methods may be time consuming or require proficiency in external data processing platforms.
By using the Max Intensity Period (MIP) feature in Sonra, the end user has the ability to extract the maximal output of a selected metric for a predefined time period using moving averages (default time window in Sonra is 3 minutes).
This period will populate in the system as a drill allowing the user to analyse the contents of the data in more detail.
Analysing for the MIP within Sonra is a simple, four-step process:
- Select the session(s), e.g. MD-2 or MD
- Select the player(s), e.g. Joe Bloggs or Sonra FC
- Select the drill(s), e.g. First Half or SSG 5 v 5
- And finally select the metric you wish to analyse, e.g. Total Distance or HMLD
Methods
A sample of three games from both the U19 and First Team were analysed. All matches were analysed for MIP using the metric High Metabolic Load Distance (HMLD) at a three-minute timeframe.
HMLD is a bespoke metric in the STATSports platform combining the High Speed Running metric and Acceleration, Deceleration activities when the event is over a Metabolic Power threshold of 25.5 W/KG.
Included in the list of metrics analysed were two custom metrics created using the Custom Metric Calculator in the Sonra software.
Relative Intensity displays the % of Total Distance covered at HMLD and % of Max Speed Entry shows the percentage of the players Max Speed reached. (Figure 1).
Using the Multi-Session Select option in Sonra, all six matches were selected for MIP-HMLD with the respective squads chosen in the player selection option to ensure all players involved in the game were analysed.
Data was viewed and exported to CSV through the Squad Period dashboard in Sonra where the Max for each metric was taken.
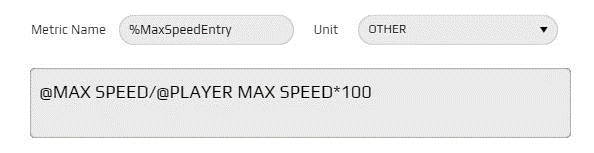
Figure 1. %Max Speed Entry in Sonras Custom Metric Calculator. Can also be used to ensure relative speed exposure is achieved in a given week.
Results and Practical Considerations
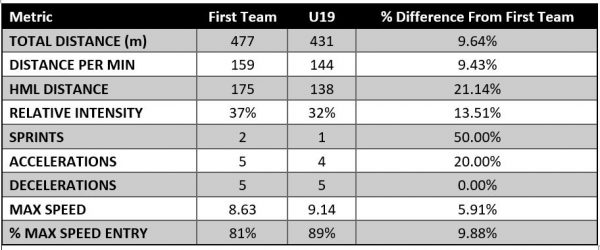
As seen from the results in Table 1 below, there are significant differences in MIP outputs between First Team and U19. The First Team had higher outputs in Total Distance, Distance per Min, HML Distance, Relative Intensity and Accelerations. The author attributes the differences between both groups to a number of factors. The primary reason being the First Team’s relative training age and physiological maturation vs the U19s squad who are still maturing.
Table 1. Comparison of 3-min PGD for First Team and U19.
From this analysis, it is clear that the peak demands of First Team football are different to Academy football.
As a result, it is vital that practitioners understand training programmes designed for First Team players may not be suitable at the Academy level.
Coaches in the Academy should be aware of the physical maturation of their players and train accordingly by analysing literature and data of the age grade they’re playing and not of the adult game.
By having the correct structures in place from a data-sharing standpoint, clubs can track an Academy player through their development to the first team and ensure that along the way they are exposed to appropriate volumes and intensities to optimally prepare them for match-play.
Through the Sonra Exchange, teams can share data for players who may participate in a number of age groups e.g. U23s to first team and vice versa.
This promotes consistency in load monitoring practices and avoids having different departments within a club operating in silos.
By adopting this approach, clubs will then be able to present a clear benchmark to everyone on what is required of players to make the adjustment from academy to first-team football.
PGD analysis will also bring value within the return to play paradox of a player as it will allow the medical/football staff to work together by using a player’s PGD as a benchmark to aim for when progressing through the rehabilitation phase, before participating in full training activities with the regular squad (Taberner et al. 2019).
A potential limitation of the study was that the playing style (formation) of both teams were not taken into consideration.
As Young et.al (2010) found that standard football formations (4-4-2, 4-3-3 and 4-5-1) derived different results in metrics such as Total Distance, High Speed Running, and High Metabolic Load Distance.
Future Developments
An area of interest within MIP analysis and a potential future direction for the MIP functionality in Sonra would be to give STATSports users the ability to calculate a team-based MIP.
This process will extract the average MIP by firstly calculating the individual MIP and averaging the data.
This will allow the practitioner to gauge the absolute physical requirements when designing a drill to mimic the PGD.
Finally, being able to view a drill replicating Peak Game Demands in real-time will allow the coaches to make decisions which affect the outcome of the drill.
Enabling this real-time feedback will ensure that training goals are met, ensuring they are fully prepared for match day.
References
- Whitehead, S., Till, K., Weaving, D., & Jones, B. (2018) The Use of Microtechnology to Quantify the Peak Match Demands of the Football Codes: A Systematic Review. Journal of Sports Medicine
- Tierney, P., Young, A., Clarke, N.,& Duncan, M . J (2016) Match play demands of 11 versus 11 professional football using Global Positioning System tracking: Variations across common playing formations. Human movement science.
- Taberner, M., Allen, T., & Cohen,D . D. (2019) Progressing rehabilitation after injury: consider the ‘control-chaos continuum’. British Journal of Sports Medicine.
Author Details
Andrew Morrissey
Senior Sport Scientist
Account Management