07 Feb Game Demands of Elite U17 Gaelic Footballers: An insight into the performance of a successful minor team in Ulster
Introduction
Gaelic football is a sport which is indigenous to Ireland, and it has always adopted a nearly professional work and training demand whilst maintaining its amateur status (1).
In recent years, this professional approach has grown and expanded as far as the sport’s elite underage athletes.
To date, there has been very limited literature available around demands of underage elite Gaelic football; which is why we have decided to conduct a small review of performance metrics achieved from a successful u17 inter-county team in the province of Ulster.
Each position has different demands from a tactical perspective (2) which will be a significant contributing factor to influencing physical demands.
The 3 positions of the game are defenders, midfielders & forwards. Recent literature has shown that there are significant differences between positions with midfielders generally covering more total distance and high speed distances compared to other positions (3).
These figures are aimed to provide a reference point for current u17 teams preparing to be able to sustain the demands of the competitive game.
Method
12 players from a male inter-county u17 team wore the STATSports Viper unit across 5 competitive games (2 halves of 30-minute duration, including added time) in Ulster, culminating in a provincial league final.
All data looked at in-game play only and allowed for first and second half comparisons to be made.
Data was then presented visually to highlight the differences if any, between the 3 main outfield positions in the game; defenders, midfielders and forwards. 8 metrics were chosen for analysis, namely; Total distance, distance per minute, accelerations (Z3-6), decelerations (Z3-6), high speed running distance, number of sprint efforts & max speed.
Previous research into team field sports has found each of these metrics to be useful when analysing performance and planning acute and chronic training loads.
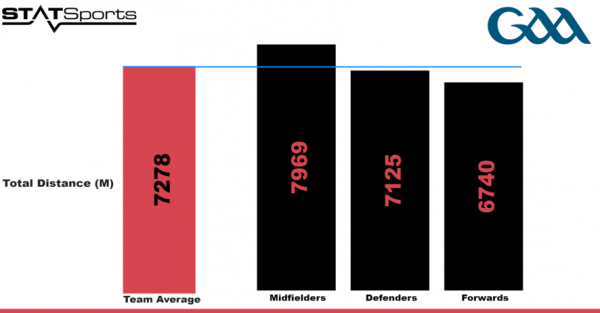
Total distance and distance per minute give a basic indicator of work completed and at what intensity, while speed-based metrics provide a greater insight into metabolic demands of the game (4,3), or more simply put; the energy cost. The graphs below display the physical demands on each position;
Total Distance: the measure in meters of how much distance an athlete covers. Total distance can be used to quantify workload in general, however it does not consider what intensity the distance was covered at, which is important for team field sport athletes.
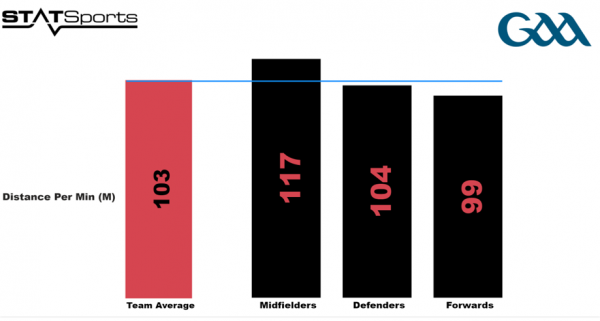
Distance Per Minute: the measure of the average distance in meters travelled every minute by an athlete.
This can used as a method of quantifying intensity of work completed, however as it is an average measure of the whole game, extended periods of little movement (such as injury stoppages) can affect the data.
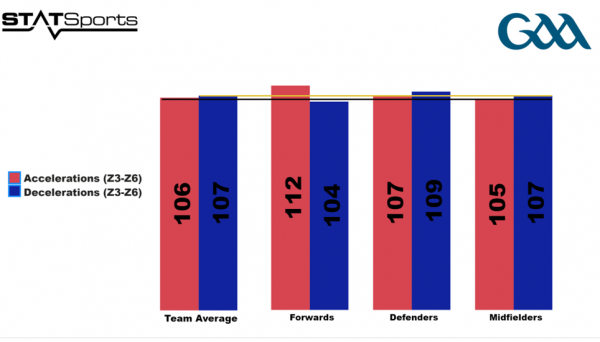
Accelerations & Decelerations (Zone’s 3-6); Accelerations that occur at a minimum speed of 2.0 m/s/s for a duration of at least 0.5 seconds.
Deceleration’s that occur at a minimum speed of 2.0 m/s/s for a duration of 0.5 seconds. Acceleration and deceleration zone’s 3-6 were specifically included as they better illustrate speeds which are important factors in developing an effort to high speed running and sprinting (5).
Zone’s 1 & 2 are significantly low speeds and would not contribute to the game play hence their exclusion.
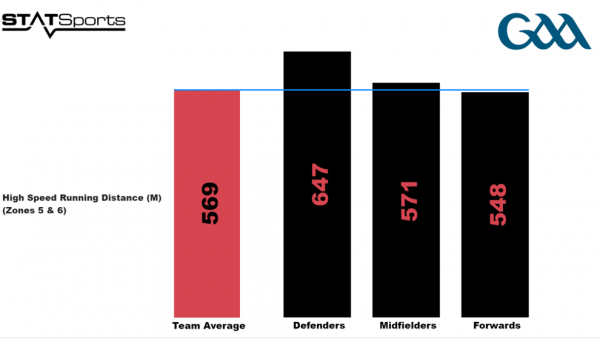
High Speed Running Distance; High speed running distance can be defined as distance covered while an athlete is in zones 5&6 of their speed zones.
Default STATSports zones were used in this instance, with a minimum speed of 5.5m/s required for a player to enter zone 5.
High speed running will require a lot of space in front of an athlete so can be used to check if a player is making attacking runs forward or indeed tracking back to help the team defend against the opposition.
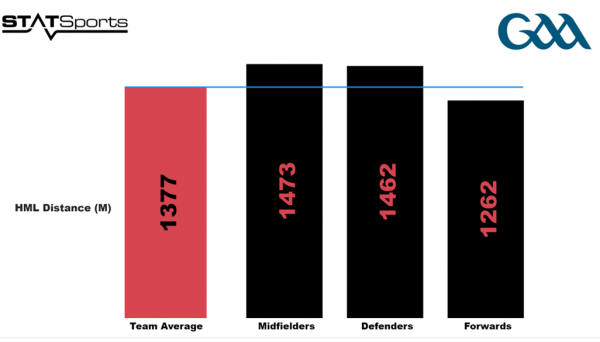
HML Distance; High metabolic load distance is a custom metric from STATSports which considers; accelerations, decelerations & high-speed running.
A more detailed explanation of HMLD is the distance travelled in meters by players when their metabolic power (energy consumption per kilogram per second) is above the value of 25.5 W/KG.
Both midfielders and forwards had similar HSR measures above however HMLD in this instance is significantly higher for midfielders showing us that the midfielders may have been required to complete more intense actions than forwards across the game.
It can be used as a method of quantifying intensity. A practical example of how teams quantify intensity is expressing HMLD as a percentage of total distance.
This can be done by implementing the formula ((HMLD/TD) *100).
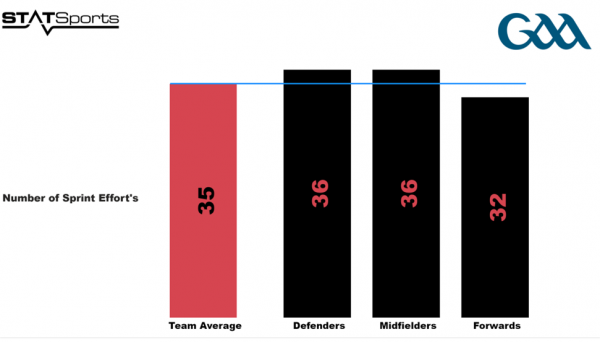
Number of Sprint Effort’s; a measure of the total number of instances where an athlete runs at a minimum speed of 5.5m/s for a duration of at least one second.
Sprint entry speed can be configured easily on an individual athlete by athlete basis which allows for coaches to monitor sprint efforts based on an athlete’s ability rather than monitoring absolute figures solely.
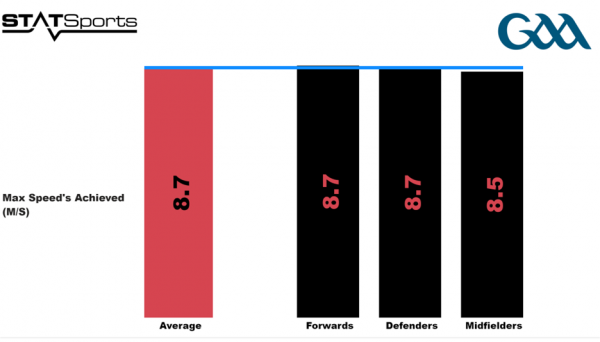
Max Speed; A measure of the maximum speed attained by an athlete during a specific session or drill expressed in the desired metric.
In this instance it is expressed in meters per second (m/s). Monitoring max speed allows coaches to gain an insight to the ability of an athlete and from a LTAD (Long-term athletic development) point of view can be used to illustrate improvement as elite youth players move through the ranks.
Changes in max speeds achieved over periods of time will also help inform the prescription of running zones as well as sprint entry speeds.
Limitations
Firstly, it is important to note that all data presented in this piece are absolute figures.
Absolute scores will look solely at the physical number achieved by the athlete for example the total distance covered in meter’s or max speed achieved in m/s while relative scores take into account the athlete’s ability or capacity in each metric and present a percentage score relative to that.
Further research is required into relative intensity scores depending on individual player’s abilities.
Secondly, as most readers will be aware, both defenders and forwards have different positions within themselves; defenders are comprised of full backs and half backs with the same applying to the forwards.
Further research into each of these positions is and the differences in their demands is also warranted in the future.
This data is designed to be a tool for comparison for u17 male Gaelic football team’s specifically, different age groups and genders will have significant differences in physical output.
Practical Applications
When planning training, game performance demands should be a heavily weighted reference point.
It has been shown that players should be exposed to high percentages of their maximum velocity regularly in training in order to prepare optimally for the velocity demands of the competitive game (6).
This data will provide a reference point with regards to overall distance covered in a game and more importantly, what percentage of the total distance is covered at high intensities.
Playing positions will influence physical demands to an extent and training should also be tailored accordingly.
Practically, exposing players to small sided games will result in high HMLD stimulus but you may be missing out on a lot of high speed running stimulus in that session, a fix to this could be something as simple as altering dimensions or playing conditions of the game to promote high speed running.
Anecdotally speaking, I found from working with this team that they found short sharp bursts of activity to be a serious strength across the group however there were only a select few who excelled at high speed running prior to training interventions being applied.
Finally, from a long-term approach GPS analysis can be used to highlight the increases in demands from youth level all the way to senior inter-county level.
This data can be considered when LTAD plans are being developed and should result young players being better prepared to sustain the level of intensity required to compete at the highest level.
This information can be used to inform planning of training for team’s who do not have access to performance monitoring technology also, however using STATSports will provide extremely detailed and accurate measurements for a coach or practitioner to monitor training live in real time and also to analyse post session.
Author Information:
Ryan Mc Laughlin, BSc, MSc, NCSC
Graduate Sport Scientist – Account Manager
References
- Beasley, K.J., 2015. Nutrition and Gaelic football: Review, recommendations, and future considerations. International journal of sport nutrition and exercise metabolism, 25(1), pp.1-13.
- Reilly, B., Akubat, I., Lyons, M. and Collins, D.K., 2015. Match-play demands of elite youth Gaelic football using global positioning system tracking. The Journal of Strength & Conditioning Research, 29(4), pp.989-996.
- Malone, S., Solan, B., Collins, K. and Doran, D.A., 2016. The metabolic power and energetic demands of elite Gaelic football match play. Journal of Sports Medicine and Physical Fitness.
- Osgnach, C., Poser, S., Bernardini, R., Rinaldo, R. and Di Prampero, P.E., 2010. Energy cost and metabolic power in elite soccer: a new match analysis approach. Medicine & Science in Sports & Exercise, 42(1), pp.170-178.
- McIntyre, M.C. and Hall, M., 2005. Physiological profile in relation to playing position of elite college Gaelic footballers. British journal of sports medicine, 39(5), pp.264-266.
- Malone, S., Roe, M., Doran, D.A., Gabbett, T.J. and Collins, K., 2017. High chronic training loads and exposure to bouts of maximal velocity running reduce injury risk in elite Gaelic football. Journal of science and medicine in sport, 20(3), pp.250-254.