
18 Mar Maximising the use of heart rate zones, metrics and thresholds
Why is it important to track heart rate?
Heart rate (HR) is one of the most appropriate methods of tracking athletes’ physiological performances in training sessions and in games.
This method of performance monitoring allows for multiple metrics to be measured during daily training with the Apex unit.
This can be completed without a high-performance laboratory and testing equipment adding to the ease of monitoring heart rate with the Apex Pro Series system.
Resting HR along with maximal HR can tell you a lot about a player’s fitness levels. From their readiness to train to their fatigue levels before and during a game, monitoring HR can allow coaches to make informed decisions on a player’s performance status.
With the Apex Pro Series system, HR can be monitored in two ways. Firstly, through magnetic HR monitors and secondly via Bluetooth HR monitors.
With Polar [1] for example, five HR zones are measured. However, in our Sonra software there are six. Figure 1 below shows the differences between the two zone models.
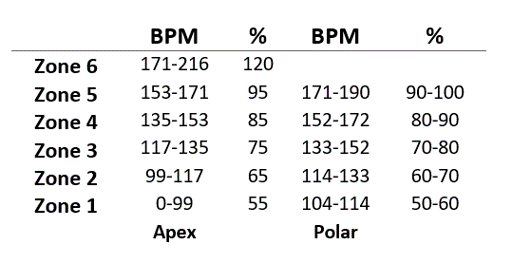
Figure 1: Comparison of STATSports vs Polar HR Zones
There is one main reason for the Sonra software to contain 6 zones for HR. Considering the five-zone model, there is no room for an athlete to go beyond their set max HR.
For example, (based on 220bpm – age formula) a 20-year-old with a max HR of 200 may be able to reach a HR of 202.
This is supported by the findings of Sarzynski et al. [2] showing that HR prediction equations do not precisely predict the maximal HR of a person, whether that be higher or lower.
New maximum HRs are not accounted for in the five-zone model. However, this is allowed for in Sonra (six zones). Sonra’s “Check for new Max values” feature allows the data to be analysed for a new max HR over a selected number of sessions or matches.
Heart rate zones
Setting HR zones in Sonra is very simple. By setting individual maximum HRs for individual players, a true representation of their HRs can be measured.
Collecting data for 4-6 weeks before individualising the zones and thresholds is recommended to give a better overall indication of where a player’s normal HR zones will fall.
Once the data is collected individual HR zones can be edited. Setting the correct HR thresholds for players is also very important to ensure that the athletes are training appropriately.
Overtraining or under-training may lead to injuries hence why training in the correct way is important.
This collected data can be analysed in the software through the zonal function where it is possible to see time spent in each HR zone on a bar graph (see figure 2).
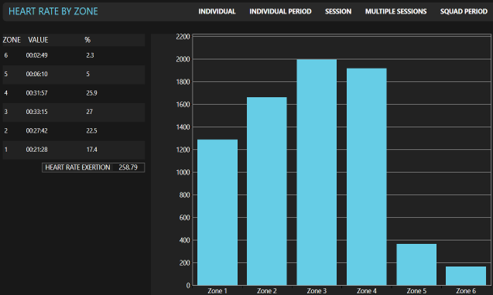
Figure 2: HR Zonal Breakdown in Apex Pro Series
Some may find this confusing if working with Polar’s 5 HR zone model as there are 6 zones in the Apex Pro Series system for HR.
In this case the Polar zones can be toggled on or off in the software. This simply shows the 5 zones on the activity graph of the individual players.
With the zones toggled on, a clear indication of where the athlete’s HR is along the 5-zone model instead of the 6-zone breakdown (see Figure 3).
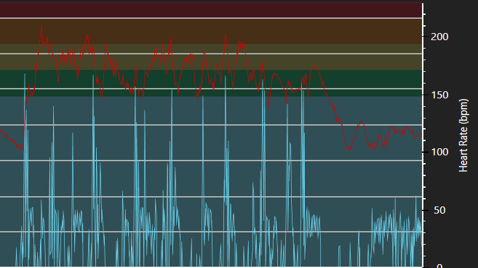
Figure 3: Screen grab of HR trace in Apex Pro Series
Apex metrics to analyse HR
Within the software there are several metrics which analyse HR data. Depending on the analysis required, different metrics will be applied to the data.
Max heart rate and average heart rate are the most basic HR metrics in the software. For each session the maximum heart rate will be recorded.
As the session progresses the average HR will constantly be updated as metrics are processed on board the Apex units themselves. Average HR may be used an indicator of the overall toughness of the session for that athlete.
HR zones are also constantly updated during the session with the duration of time spent in each zone contributing to the “Time in heart rate zone” metrics.
Time spent in each zone can show the trainer or coach if the training was too tough for the player enabling them to alter the session to suit the player’s needs.
On the contrary, the same logic can be applied, making the session tougher if the player found it too easy for their ability.
Time in Red Zone is a very useful metric to track how hard the player is working using HR data.
Time spent in the red zone is recorded when the threshold for the HR zone 5 (85%) is crossed for that individuals HR.
Too much time spent in the red zone may be a detriment to the player’s performance. Contrary to this point, time in the red zone may be used by coaches to replicate match demands for players during training sessions.
Heart rate exertion is a weighted metric along a log scale of HR percentage based on a convex curve. Each HR score is weighted accordingly with higher HRs adding a higher value to the overall exertion score. For example, a player whose HR does not fall below 150bpm will have a higher HR exertion than a player who spends periods of time below 150bpm due to the weighted nature of this metric.
Heart rate variability considers the variation in beat-to-beat intervals between individual heart beats average over 2 minutes.
This metric may be used as a guide to how recovered athletes are from previous training sessions, with less variability correlating to sub optimal physiological conditions i.e. the player may not be recovered sufficiently for training or may be falling ill.
As shown from Figure 2 and Figure 3 it is possible to visually analyse the data in the software itself, however, it is also possible to export all metrics, including HR metrics, to excel and in PDF format (see Fig 4).
This allows for the creation of HR databases and further analysis if necessary. PDF reports from the software can be sent directly from the software or iPad to coaches and players.
These reports only take a few minutes to complete and can be sent from the training ground directly after training.
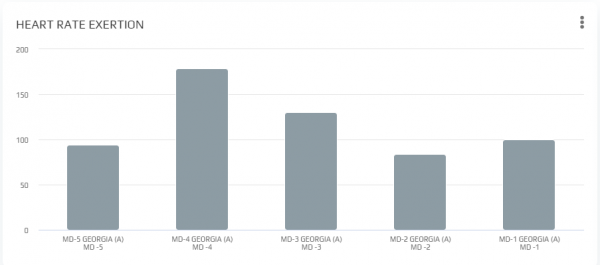
Figure 4: Individual Period of primary HR metrics
Conclusion
Through analysing data in the Apex Pro Series system, it is clear to see that a multitude of HR metrics can be generated and interpreted.
From Time in Red Zone to monitoring players recovery, HR can prove to be a very useful method of tracking player’s physiological performance and readiness to play.
With emphasis on the HR zones it is possible to measure if the athletes are training in the correct way to prevent overtraining and minimise injury risk.
References
- Polar UK. (2018). Polar Heart Rate Zones | Polar UK. [online] Available at: https://support.polar.com/uk-en/support/tips/Polar_Sport_Zones [Accessed 24 Oct. 2018].
- Sarzynski, M., Rankinen, T., Earnest, C., Leon, A., Rao, D., Skinner, J. and Bouchard, C. (2013). Measured maximal heart rates compared to commonly used age-based prediction equations in the heritage family study. American Journal of Human Biology, 25(5), pp.695-701.
Author Details
Sport Sci Department