
05 Jun Monitoring High Speed Running Demands in Youth Soccer Players; Absolute or Individualised Thresholds? A Case Study
Introduction
Soccer is an intermittent sport which requires numerous bouts of high intensity running throughout gameplay.
Although high intensity running only accounts for 10-20% of the total distance covered in a game, it is shown to be performed during the more important phases of play [1, 2, 3].
Research has observed an evolution in the physical output of soccer players, with a substantial increase in the high speed activities [2, 3].
This increase in high intensity activity may be explained by the evolution of the game found from 1996 to 2010, with a distinct increase in ball speed, passing rate and the duration of pauses in play [4].
High intensity activities are a vital component of the modern game and should be monitored during competition and training phases from a performance and injury prevention perspective [5].
Speed Zones – Absolute or Relative?
Speed zones help describe and quantify the volume of running imposed on a player at a certain speed threshold.
STATSports offer 6 customisable speed zone bands that can be applied at both an Absolute and a Relative level, each zone has a maximum and minimum speed that can help users understand these demands imposed on players.
The top 2 Zones (Zone 5 & Zone 6) refer to High Speed Running (HSR), which can be analysed as HSR (Absolute) and HSR (Relative).
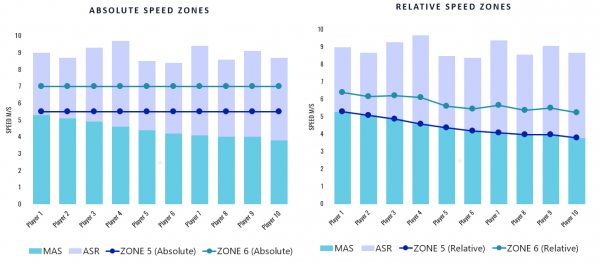
Figure 1. Application of Absolute HSR Zones (5 & 6) across a squad with various fitness levels compared with Relative HSR Zones (5 & 6) based on individual fitness levels.
Absolute Zones refer to fixed values typically derived from research to quantify distance covered at various movement speeds.
Distance covered over 19.8Km/h (5.5m/s) has been used to quantify the HSR (> Zone 5) demands in soccer, with 25.2km/h (7m/s) to dictate Very HSR (Zone 6) for many years.
Absolute Speed Thresholds apply to all players (across a Squad or a Group) and do not differentiate amongst athletes even when physiological differences are present (see Figure 1) [6].
Relative Zones refer to those set specific to that athlete only. Typically, Relative HSR Zones are based on a physiological marker reflected in that specific athlete.
There are several ways in which speed zones can be individualised. A commonly used method is setting speed zones based on a percentage of the given athlete’s max speed.
However, using this method may not give a true representation of the athlete’s physical capacity as it only accounts for one physical aspect in that athlete.
Therefore, Individual speed thresholds should be set using at least two physiological markers for more accurate data [7, 8].
Max Speed, Maximal Aerobic Speed (MAS) and Anaerobic Speed Reserve (ASR) are shown to be an effective and easy to attain combination of characteristics that may help create an understanding of the physical capacity of an individual.
To assess the effectiveness of Absolute and Relative HSR Zone classification in youth soccer, a case study was carried out.
Methods
Eighteen youth male outfield soccer players from a League of Ireland (LOI) U17 squad (Age = 16 years ± 7months), were analysed over five in-season competitive games (90 minutes plus additional time).
Players were split into groups based on playing position in each game including Central Defender (CD) (n = 4), Wide Defender (WD) (n = 3), Central Midfielder (CM) (n = 3), Wide Attackers (WA) (n = 5) and Central Attackers (CA) (n = 3). Only players who played in the entire game were included for analysis.
Absolute Zones were set using STATSports default zones; Zone 5 (Ab) = 5.5 – 7 m/s, Zone 6 (Ab) = >7 m/s.
Therefore, HSR (Ab) was the distance covered at or above 5.5m/s. Relative Zones were set by attaining the individuals Max Speed (m/s) using a 40 sprint test and their MAS (m/s) using a set distance time trial (1600m).
After attaining these variables, ASR was calculated (Max Speed – MAS = ASR), Relative Zones were set using these results; Zone 5 (Rel) = MAS – 30% ASR, Zone 6 (Rel) > 30% ASR. HSR (Rel) was considered as the distance covered when the athlete was running at a speed above their MAS.
Results
There were clear differences observed in the HSR output of the players between Absolute and Relative HSR thresholds.
HSR (Rel) distances accounted for 15% of the total distance covered during match play (Distance Zone 5 (Rel) = 10.51%; Distance Zone 6 (Rel) = 4.49%), whereas, HSR (Ab) distances made up only 5.35% of the total distance covered (Distance Zone 5 (Ab) = 4.48%; Distance Zone 6 (Ab) = 0.87%).
When using individualised speed zones (Relative) there was little differences in HSR output between playing position except for WD and CM (WD covering significantly more HSR (Rel) than CM).
More significant positional differences are evident in HSR output when Absolute thresholds are applied with CA, WA and WD covering significantly more HSR (Ab) than CD and CM (See Figure 2).
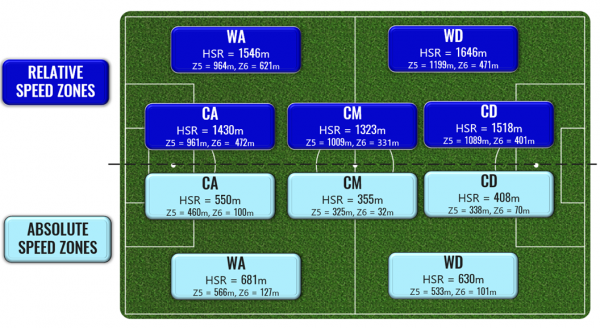
Figure 2. HSR Distances per positional group during gameplay with Relative Zones applied and Absolute Zones applied.
Practical Considerations
When Absolute HSR Zones are analysed exclusively in youth soccer players, HSR output may be underestimated.
This appears across all groups regardless of playing position. Therefore, the use of Relative HSR Zones may provide a better understanding for practitioners of the true physiological demand and HSR exertion of each player.
However, when the HSR thresholds are set using MAS and 30% ASR, distance covered and number of efforts at or close to maximal velocity may not be recognized.
Thus, the writer suggests that to acknowledge these efforts, practitioners should utilize the 6 customizable zones provided by STATSports, dropping the relative HSR Zone entry speed (Zone 5) down to the Zone 4 entry speed (i.e. Zone 4 = >MAS).
The adjusted relative zones may look something like this; Zone 4: MAS – 30%ASR, Zone 5: 30%ASR – 60%ASR, Zone 6: >60% ASR.
This way practitioners can monitor distance covered above MAS while also monitoring the very HSR distances and efforts.
Alternatively, the Sprint metric could be used to determine efforts and distance covered at very high speeds. The Sprint entry speed can be set at a fixed value or at a % of the individuals max speed.
This is not to say that Relative Zones are superior than Absolute Zones. In fact, irrespective of fitness levels, HSR demands in soccer have been investigated throughout a wealth of research using Absolute speed thresholds showing the demands imposed on players during competition.
Hence, why sports scientists and coaches should consider monitoring HSR using Absolute Speed Zones to ensure that players are prepared for demands of the game as they progress to first team football.
Both Absolute and Relative HSR Zones have equal importance in the development of youth soccer players.
Absolute HSR Zones will allow practitioners to compare players across a positional group or squad while also showing the demands that players will be exposed to in competition regardless of fitness levels.
Understanding these Absolute HSR demands of the game will allow practitioners to create drills based on game intensities to expose players effectively.
The use of Relative HSR demands may help provide a better understanding of the physiological cost of a game or session specific to that individual’s physical capacity.
It is important that practitioners know the difference between both Absolute and Relative Speed Zones to ensure they are aware of what they are monitoring and why.
To learn more about how GPS can aid practitioners to measure an individual athlete’s MAS score, take a look at Jack’s previous insight here.
References
- Bloomfield, J., Polman, R., & O’Donoghue, P. (2007). Physical demands of different positions in FA Premier League soccer. Journal of Sports Science & Medicine, 6(1), 63.
- Barnes, C., Archer, D. T., Hogg, B., Bush, M., & Bradley, P. S. (2014). The evolution of physical and technical performance parameters in the English Premier League. International Journal of Sports Medicine, 35(13), 1095-1100.
- Di Salvo, V., Gregson, W., Atkinson, G., Tordoff, P., & Drust, B. (2009). Analysis of high intensity activity in premier league soccer. International Journal of Sports Medicine, 30(3), 205–212.
- Wallace, J. L., & Norton, K. I. (2014). Evolution of World Cup soccer final games 1966–2010: Game structure, speed and play patterns. Journal of Science and Medicine in Sport, 17(2), 223-228.
- Di Salvo, V., Gregson, W., Atkinson, G., Tordoff, P., & Drust, B. (2009). Analysis of high intensity activity in premier league soccer. International Journal of Sports Medicine, 30(3), 205–212.
- Sweeting, A. J., Cormack, S. J., Morgan, S., & Aughey, R. J. (2017). When Is a Sprint a Sprint? A Review of the Analysis of Team-Sport Athlete Activity Profile. Frontiers in physiology, 8, 432.
- Abt, G., & Lovell, R. (2009). The use of individualized speed and intensity thresholds for determining the distance run at high-intensity in professional soccer. Journal of Sports Sciences, 27(9), 893-898.
- Buchheit, M., Mendez-Villanueva, A., Simpson, B. M., & Bourdon, P. C. (2010). Repeated-sprint sequences during youth soccer matches. International journal of sports medicine, 31(10), 709-716.
Author Details
Jack Traynor
Sport Scientist l Sport Science Dept.