06 Oct Real Time Drill Intensity Monitoring with Sonra Live
Introduction
The Drill Intensity feature in Sonra Live is one of STATSports most recent improvements to the Sonra product suite.
The drill intensity feature allows practitioners to easily monitor the intensity of sessions and drills. This can help inform practice in real-time and allow practitioners to make any necessary changes or interventions.
Practical Applications
One of the main advantages of GNSS technology is the ability to better understand the locomotive profiles and physical demands of sport.
GNSS technology also provides valuable data that can be used to develop athlete’s fitness to make sure they are physically capable and ready to compete in competition.
This data can be monitored in real-time to maximise the effect of drills in gaining the desired physiological response.
Sport scientists can use the locomotive profiles gathered from competitive match play to influence drills and training sessions.
Replicating or exceeding game/competitive intensities during training sessions or drills helps to ensure athletes are being exposed to enough load to both become and maintain physically prepared for competition.
Delaney refers to matching and surpassing the demands of competition in order to maintain and improve performance as part of his concept of ‘game speed’.
The physical component of ‘game speed’, in its basic form, looks at the intensity at which competition is being played at. This can be done both in terms of a full match or in smaller, more specific time frames [1].
The below chart shows an example of average match intensity (m/min) compared to a 5-minute moving average.
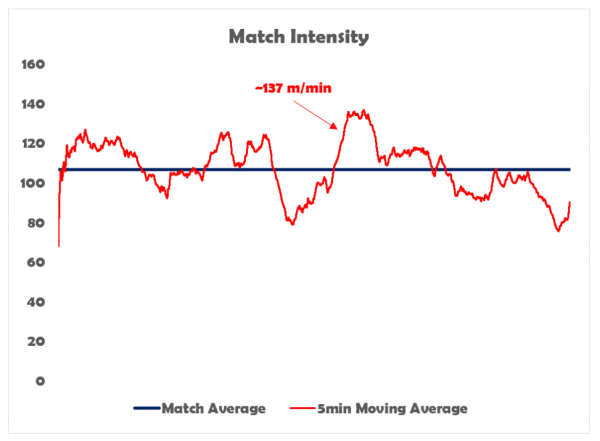
Figure 1. Average and 5 min moving average match intensity [1].
It is clear to see the differences between the two, with the 5-minute rolling average showing fluctuations well above and below the average match intensity.
This is to be expected considering the stop/start nature of field sports. Therefore, identifying match intensity during smaller time frames and using these values may be more specific to performance than using overall match intensity.
Doing this again, but this time looking at rolling averages from 1 – 10 minutes we can see how match intensity for these periods tend to be higher on average when compared to overall match intensity.
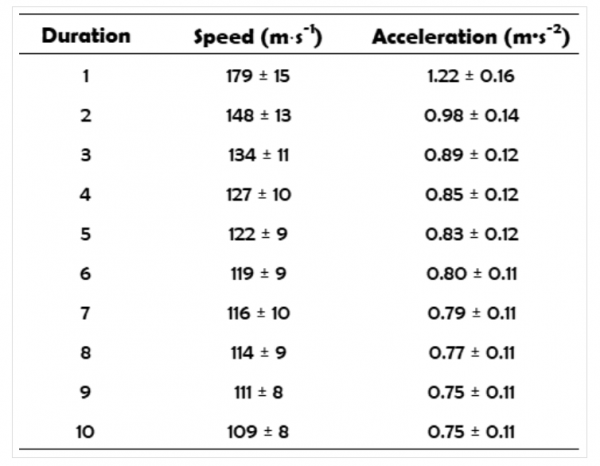
Figure 2. Rolling average match intensity from 1 – 10 min [1].
These values give a better indication of various intensities players are exposed to during competition.
These values can be used to base your drill intensity indicator on, depending on the desired physiological aim and duration of the drill.
For example, if taking part in blocks of 4 minute small-sided games. The drill intensity indicator can be set at 127 m/min to see how each drill compares to the intensity of a real match.
This will provide information, at-a-glance, to tell if the particular drill is above, at, or below match intensity.
Attention should also be given to the intensity of different formations, positions, and ball in play durations. Riboli et al. found that in football, intensities differ for these variables across a number of metrics, including, Total Distance, High Speed Running and High Metabolic Load Distance [2].
Riboli et al. further suggests that it is also important to understand the intensity of worst-case scenarios or Maximum Intensity Periods (MIP) in sport.
This is because rolling averages don’t account for these periods in matches, which are often significantly above the norm [2].
This may lead to athletes being under prepared for such events in fixtures, and so they should be exposed to these potential intensities during training in-line with your own periodisation.
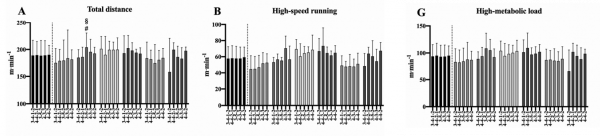
Figure 3: Differences in 1-min MIP for each position within different formations, shown for all players. Riboli et al. [2]
Mernagh et al. suggests that for MIP, paying attention to Total Distance, High Speed Running and High Metabolic Load Distance can allow for maximal physical-performance development [3].
These three metrics can be used within the Drill Intensity feature in Sonra live with customisable intensity bands.
Maximum intensity period (MIP) analysis can be conducted in the Sonra desktop software for your own customisable time periods.
MIP analysis can be conducted for multiple players at an individual level, and this provides a quick and easy way to identify your squad and player’s game intensity.
This will give the user values for which to use in the Drill Intensity Feature.
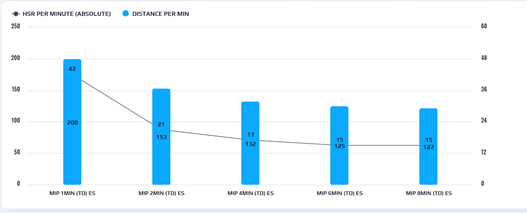
Figure 4. Distance and HSR Per Min values across various MIP durations in Sonra Software.
Setting up Drill Intensity
The Drill Intensity Feature is available on the Sonra Live app and uses five different indicators to quickly identify the intensity of live drills.
To toggle on this feature in the Sonra live application, go to Settings > Graphs and Drills and scroll down to where you see the ‘Enable Drill Intensity’ option.
Simply click on the toggle so it is green, and the Drill Intensity indicator will begin to show on any live drills during the session.
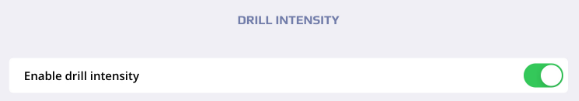
Figure 5. Enable Drill Intensity Feature in Sonra Live Settings.
Below this you will see that you have the choice of selecting from three different metrics.
You can select one of; Distance Per Minute, High Speed Running Per Minute and High Metabolic Load Distance Per Minute.
The selected metric will be highlighted in blue and the Drill Intensity Scale specific to that metric will appear below.
During a session users can cycle between these three metrics, and also change your intensity bands. The intensity indicators for each drill will update depending on any changes.
Each of the metrics has its own unique scale/bands which you can customise by inputting a value for each indicator or band.
Each band has its own-coloured arrow that will be displayed next to a drill if it falls into that intensity range.
To change this, simply tap on the number below each arrow and enter the desired value (Drill Intensity Scale – Sonra Live).
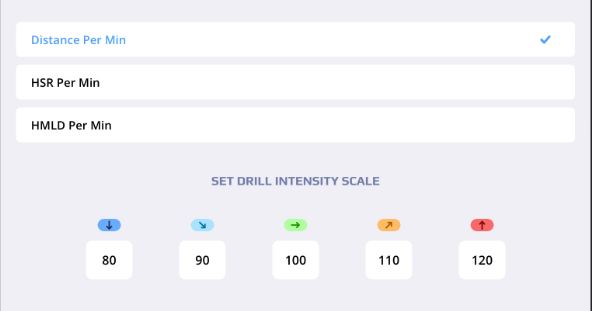
Figure 6. Customisable Drill Intensity Scale in Sonra Live.
All the above steps can be also done in the Sonra desktop application also.
This means users can predetermine their Drill Intensity settings and sync this information across to their iPad(s) before sessions to ensure consistency and maximise time efficiency on the field.
Users will find the option to do this by navigating to Settings > Live and scrolling to the bottom where you will see the same Drill Intensity section as on the iPad app.
Simply toggle on the Drill Intensity feature, then enter the desired intensity values.
After this a sync must be performed with the iPad by using the ‘send updated player profiles’ option to bring across all updated information to the iPad.
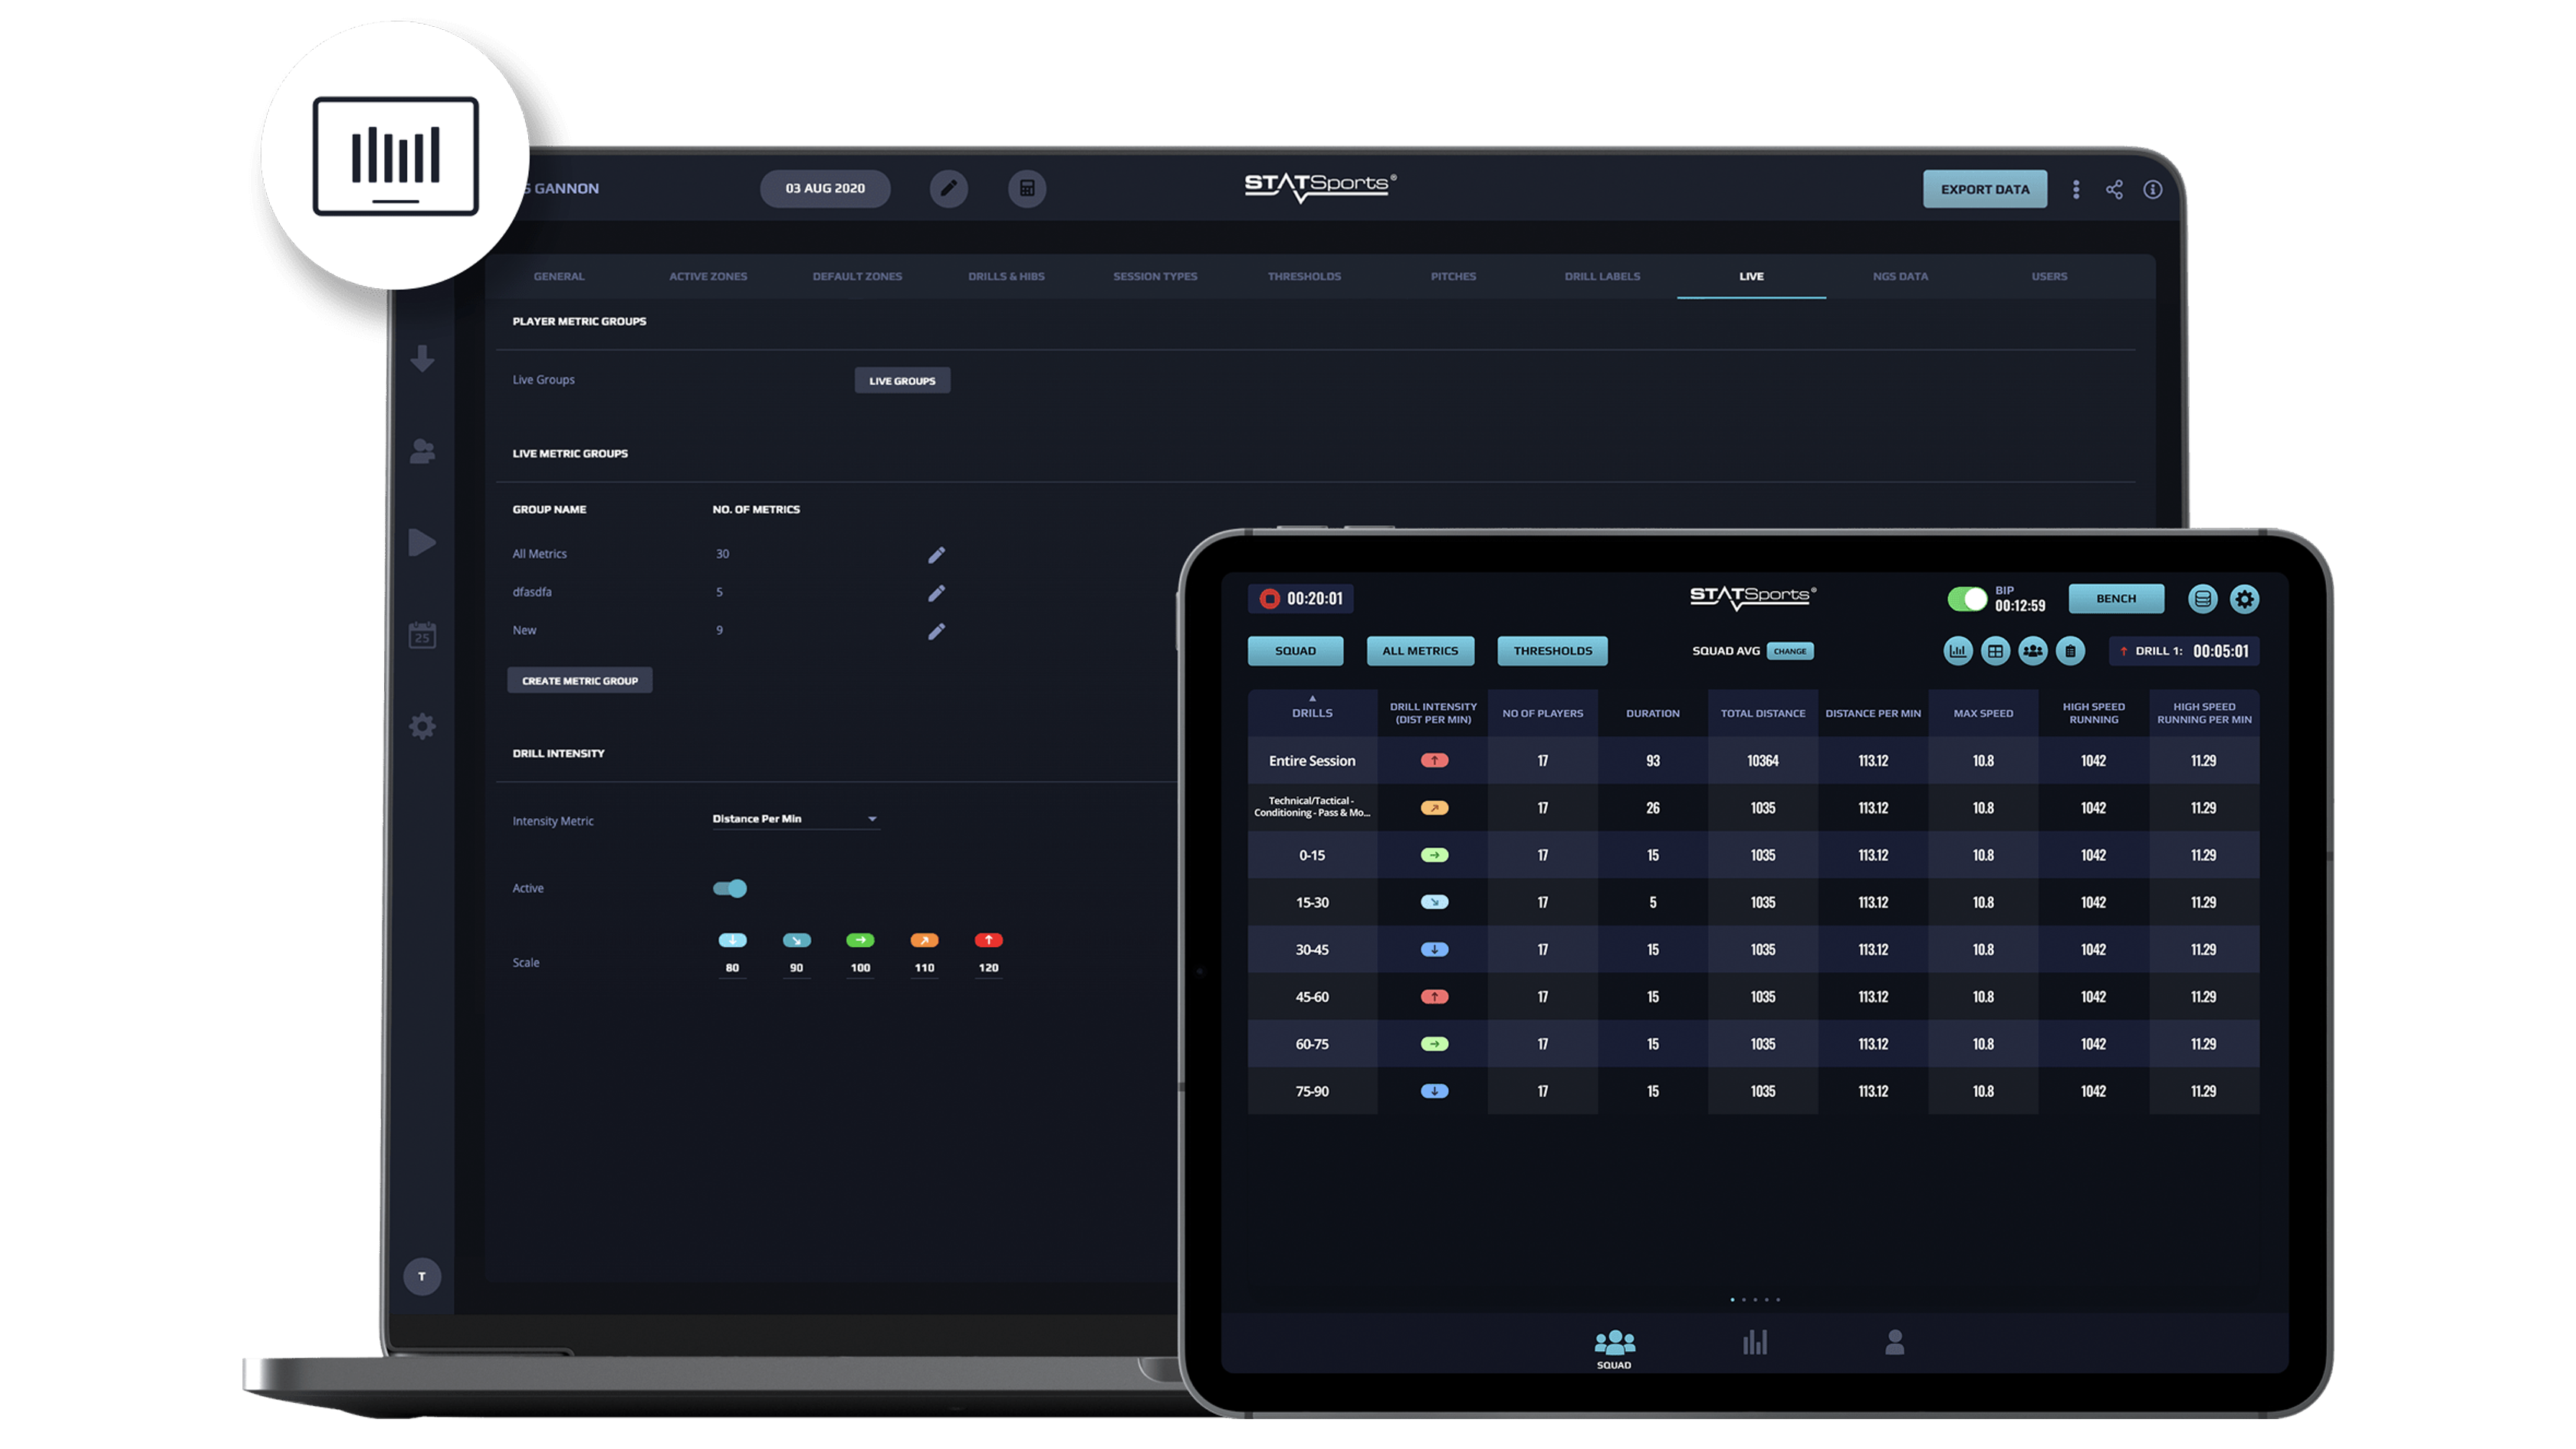
Figure 7. Predetermining Drill Intensity Values in Sonra Desktop.
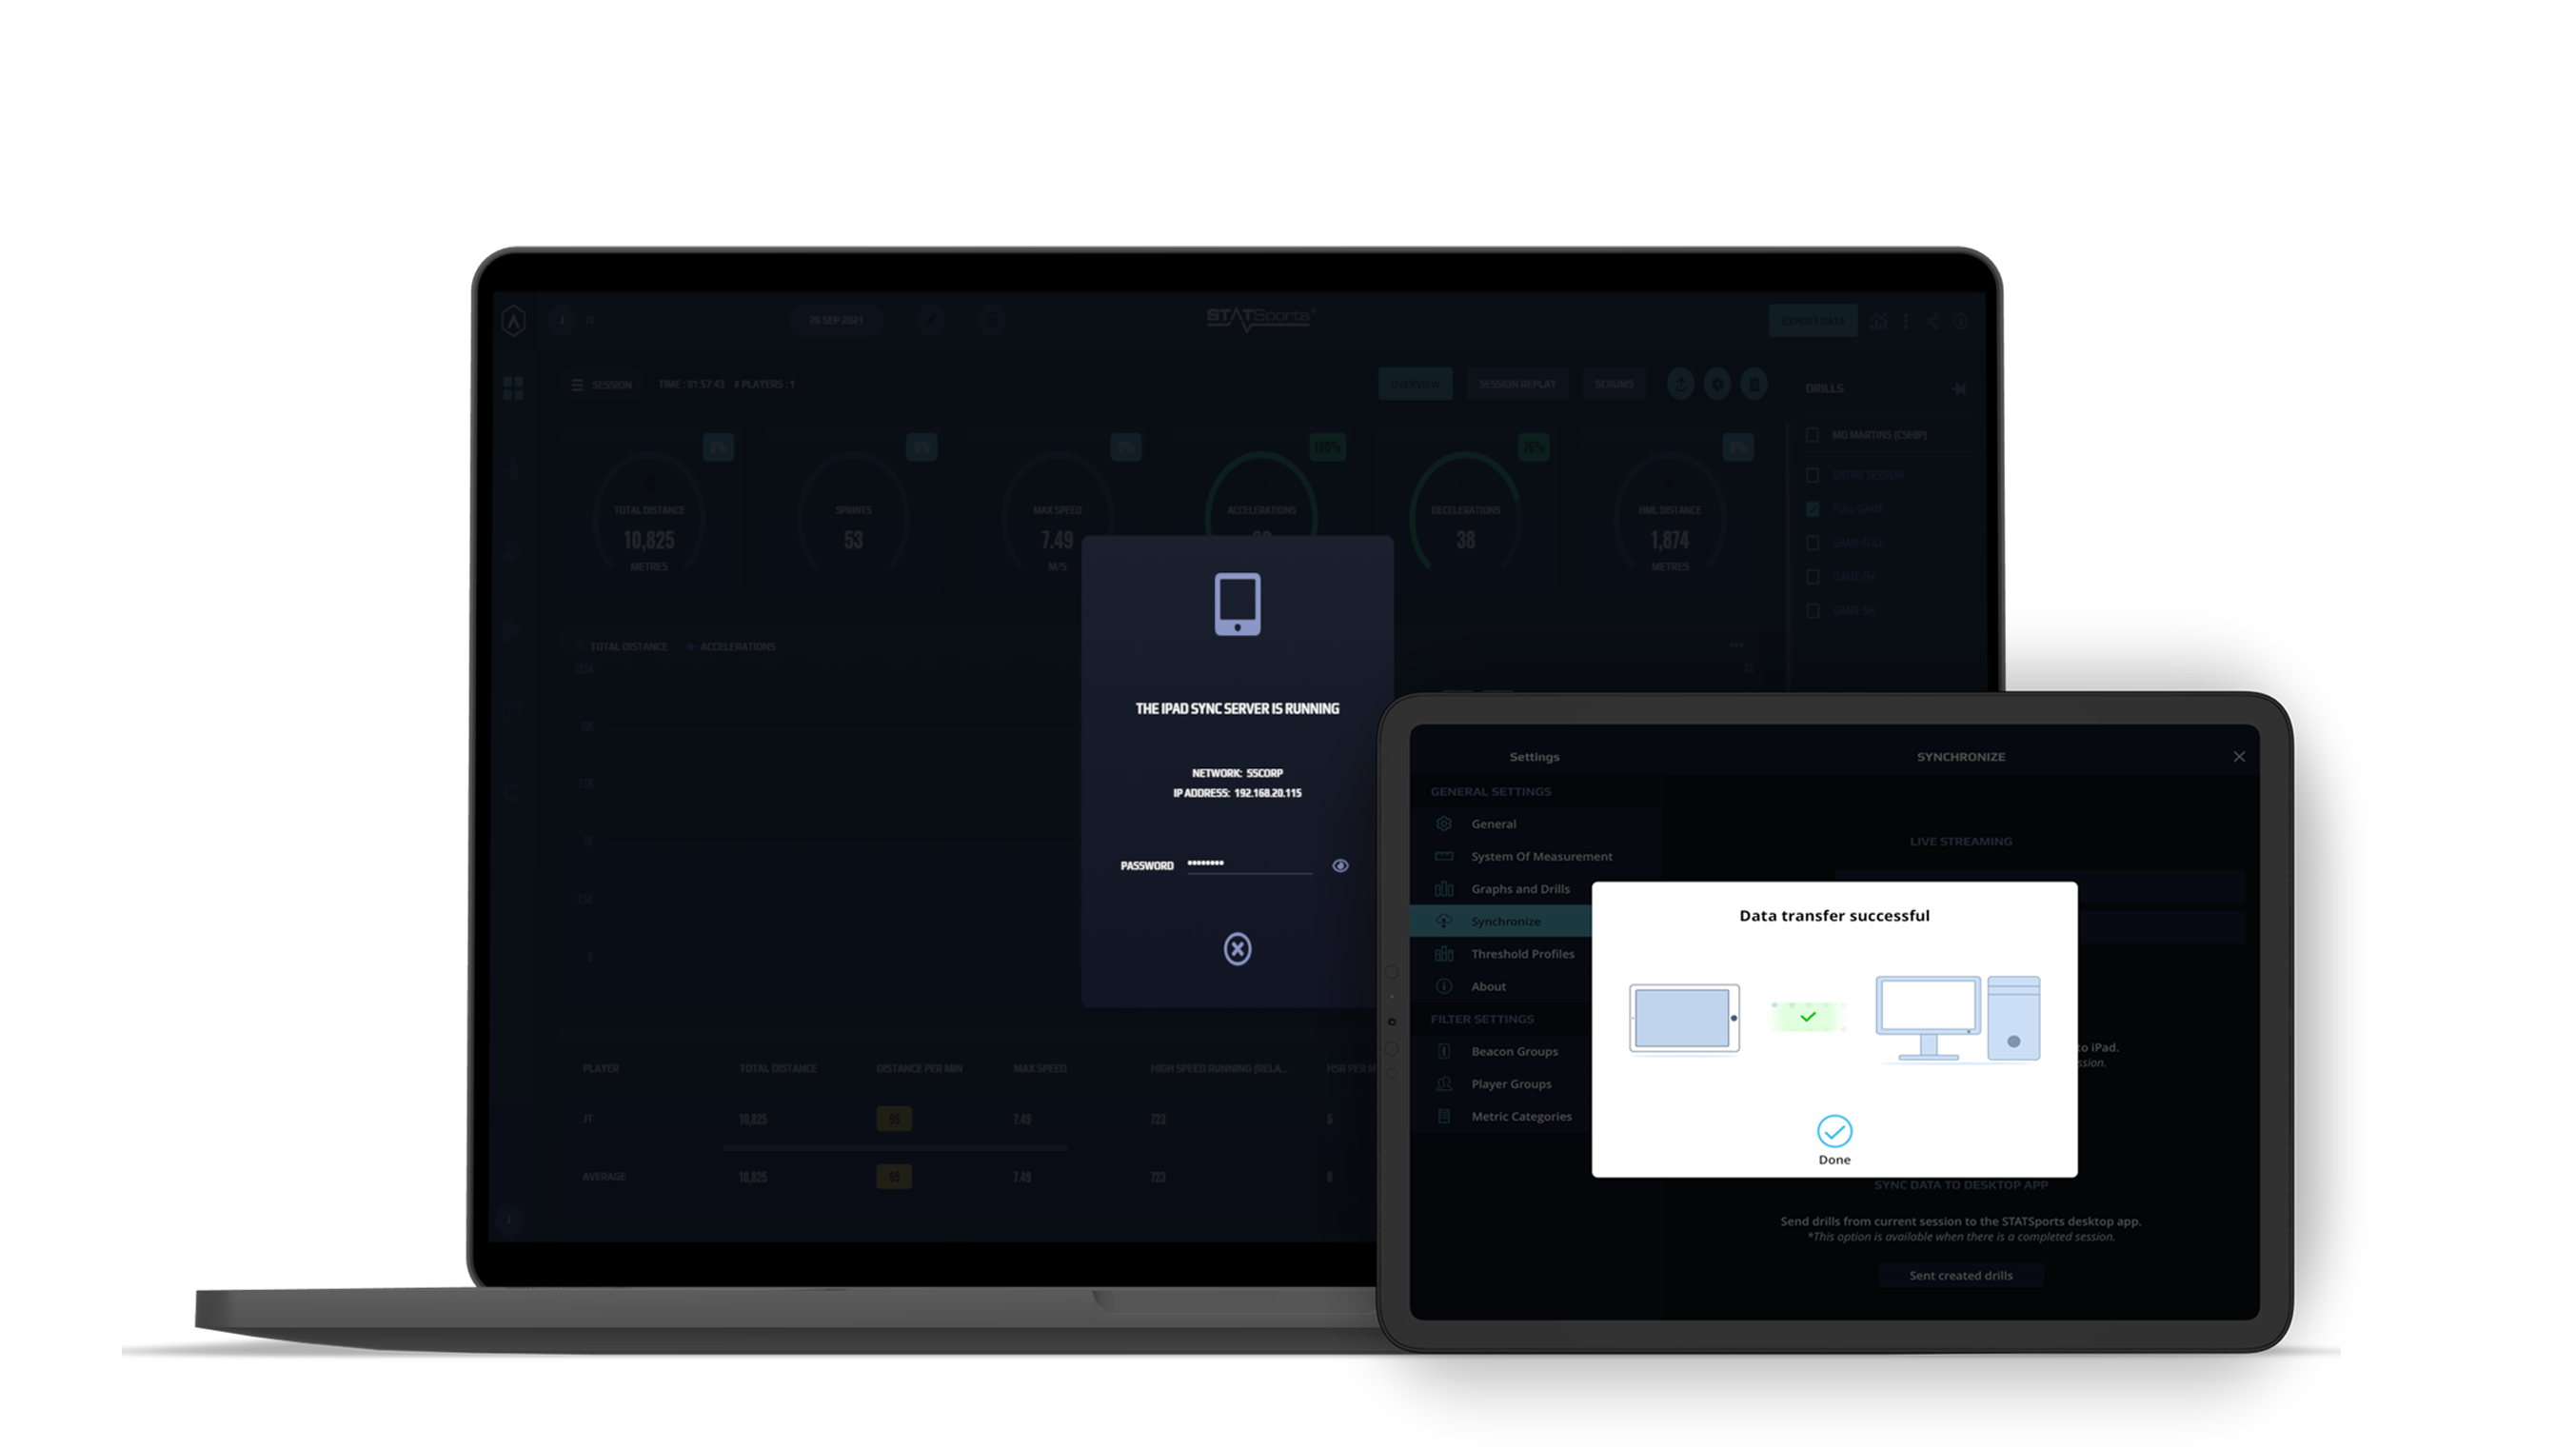
Figure 8. Sync function in Sonra Live iPad app.
Once this process has been completed, the Drill Intensity feature is ready to be used.
The Drill Intensity indicators will automatically appear next to all drills in both the main view and drill dropdown list, as shown below.
Providing you with a quick and easy way to monitor intensity in real-time.
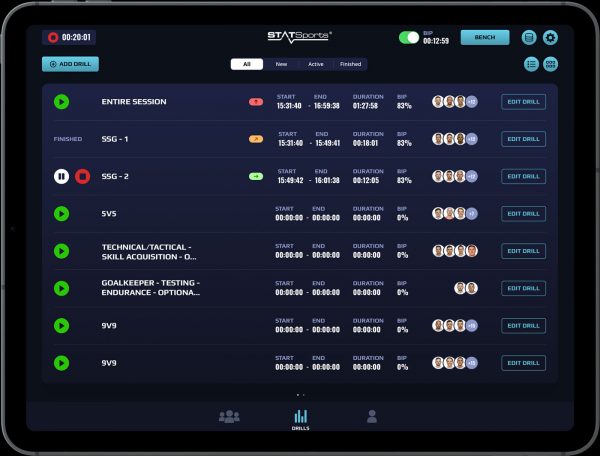
Figure 9. Drill Intensity Indicators shown across each Drill the Drill Tab on Sonra Live.
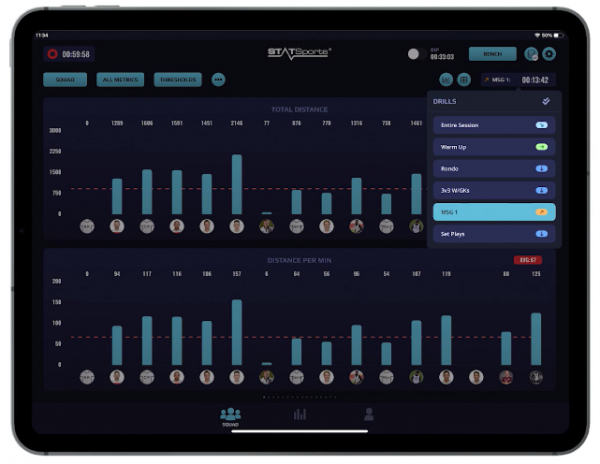
Figure 10. Drill Intensity Indicators shown across each Drill on the Drill Selection pane on Squad Tab on Sonra Live.
References
- Delaney, J. (2018), How you should be using GPS (Part 1): GAME SPEED, accessed fromHow you should be using GPS (Part 1): GAME SPEED – Sports Performance Explained (sportperfex.com)
- Riboli, A., Semeria, M., Coratella, G. and Esposito, F., 2021.Effect of formation, ball in play and ball possession on peak demands in elite soccer. Biology of Sport, 38(2), pp.195-205.
- Mernagh, D., Weldon, A., Wass, J., Phillips, J., Parmar, N., Waldron, M. and Turner, A., 2021. A Comparison of Match Demands Using Ball-in-Play versus Whole Match Data in Professional Soccer Players of the English Championship. Sports, 9(6), p.76.