
17 Jun Stadium Data – A Premier League Report
Introduction
STATSports APEX device utilises the latest in Global Navigation Satellite Systems (GNSS) technology to enhance the quality of data captured in challenging environments, such as confined semi enclosed stadia or built up areas where signal reception may be compromised.
APEX works off GNSS which can communicate with multiple satellite systems (e.g., global positioning system (GPS), GLONASS, Galileo, and BeiDou) simultaneously, and thus providing more accurate positional information.
Regional Satellite-based Augmentation Systems (SBAS) further improves the accuracy and reliability of GNSS information by correcting signal measurement errors and providing information about its accuracy, integrity, and availability.
SBAS uses GNSS measurements taken by accurately located reference stations deployed across an entire continent (1).
A recent publication by Johnston et al. demonstrated significant discrepancies between GPS providers when used in challenging stadiums determined by the mean number of satellites connected during match activities (2).
The same study showed that APEX, powered by augmented GNSS, connected to an average of 17.7 satellites during NRL games compared to a competitor, powered by single constellation GPS, which recorded an average of 10.5 satellites in AFL match-play.
This insight intends to demonstrate the APEX devices ability to deliver the most accurate, consistent, and reliable data in challenging stadium environments in the English Premier League.
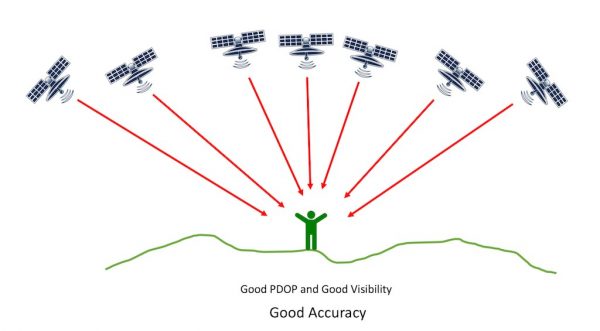
Figure 1. Good PDOP and good visibility Indicated by satellites spread evenly throughout the sky
Methodology
Data was provided by an English Premier League team for a total of 20 games that included each team currently in the top-flight of English football (19/20 season).
2 of the 20 samples were taken from the previous domestic league season (18/19), one sample from the 17/18 league season and one sample from an EFL cup game (19/20).
A sample of 3 players was taken from each game with all the primary positional groups covered i.e. defender, midfielder and forward, to ensure any potential variation between positions was accounted for in the analysis.
Each player was equipped with an APEX GNSS device. The same device was worn by each player, as to minimise interunit variability.
The validity of the APEX device to quantify athlete movement at varying speeds in team sports has been demonstrated in previous research and is a certified device under the FIFA Quality Performance test reports for EPTS (3).
Before the start of each match, the units were switched on approximately 20 minutes before the warm-up and housed in a specifically designed, manufacture-provided vest.
The quality of the data was determined by recording the horizontal dilution of precision (HDOP), horizontal accuracy (HACC), and the number of satellites.
HDOP – Dilution of Precision is a term used to describe the strength of the current satellite configuration, or geometry, on the accuracy of the data collected by a GPS or GNSS receiver at the time of use.
HDOP is a factor in determining the relative accuracy of a horizontal position (4).
With GPS receivers, when satellites are grouped together in the same general area of the sky, the satellite geometry is considered to be weak (higher DOP value).
When satellites are evenly spread throughout the sky (Figure 1), their geometry is considered strong (lower DOP value).
Thus, the more satellites available spread evenly throughout the sky, the better our positional accuracy will be (and the lower the DOP value).
HACC – represents the error of measured position compared to the absolute position of the receiver, projected in the horizontal plane.
In APEX, HACC is represented by a number between 0 and 7. Values below 1 are considered military level (less than 0.5m error), values below 5 are good (less than 2m error), values of 7 are almost unusable.
No. of Satellites – The total number of satellites used in the calculation of the unit’s position.
The data used for analysis accounts only for players who participated in the full game, with all data generated during the half-time period being excluded from the analysis.
The satellite information associated with each player’s positioning throughout the session was logged at a frequency of 10Hz.
In total, 60 session files and over 90 hours of session data were obtained as part of the investigation. The Raw Data Extended file (Figure 2) was exported from Sonra and analysed in Microsoft Excel where descriptive statistics were calculated and reported as an average.
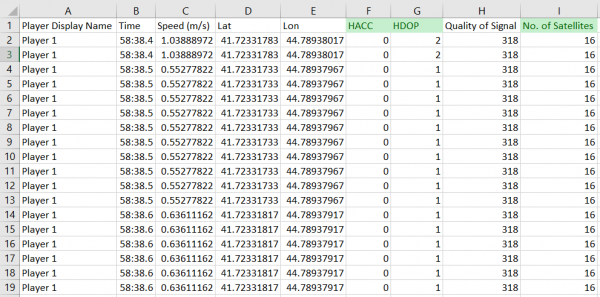
Figure 2. Raw Data Extended file from Sonra showing metrics of interest, highlighted in green.
Findings/Results
Figure 3 (below) shows a comparison of the average satellite count for a single game in each of the English Premier League stadia.
The stadium that reported the highest average number of satellites was West Ham’s London Stadium (n = 21).
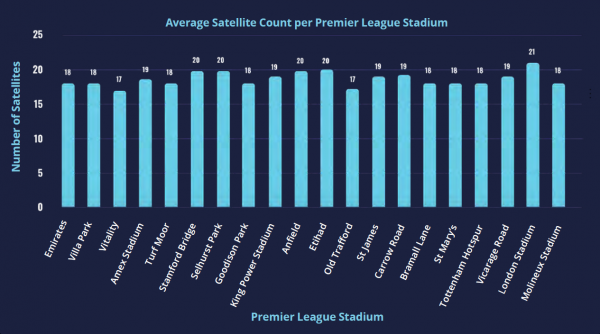
Figure 3. Comparison of the Average Satellite Count per Premier League stadium
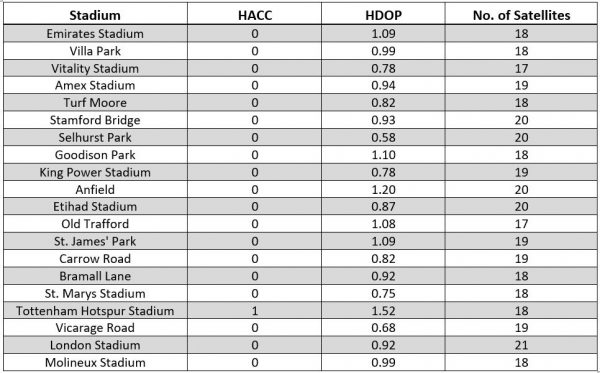
The data in Table 1 (below) shows how each stadium has performed as determined by our three previously identified satellite-related metrics.
The best performing stadium, as indicated by the minimum HACC and HDOP values, was Selhurst Park with 0 and 0.58, respectively.
The average HACC and HDOP values across all Premier League stadia were 0 ± 0.22 and 0.94 ± 0.21, respectively.
Both of which are recognised as military accepted levels of accuracy. No significant differences were found when comparing the satellite quality data across each of the primary positional groups.
Table 1. Comparison of the Average HACC, HDOP and No. Of Satellites in Premier League Stadiums
Conclusion
Currently, there is limited, if any, research available in the literature on GNSS satellite quality in stadium environments in a sporting context.
Future research aims to investigate stadium data quality across different sports and in different regions around the world.
The provision of raw data in Sonra, such as that contained in the extended raw data export, gives the user the opportunity to analyse and manipulate their stadium data in whatever way they choose without restriction.
The CSV format of the export facilitates importing to any number of other software programmes enabling more in-depth analysis or visualisation of the data.
STATSports are, and will continue to be, committed to data transparency with data collected using our APEX system.
In conclusion, as can be seen from the results, the APEX device provided accurate and reliable data, as determined by the average number of satellites, HACC and HDOP values, throughout all 20 English Premier League stadia.
References
- Geography, G. (2019). GPS Accuracy: HDOP, PDOP, GDOP, Multipath & the Atmosphere. Retrieved June 17, 2020, from Remote Sensing website: https://gisgeography.com/gps-accuracy-hdop-pdop-gdop-multipath/
- Johnston, R. D., Thornton, H. R., Wade, J. A., Devlin, P., & Duthie, G. M. (2020). The Distribution of Match Activities Relative to the Maximal Mean Intensities in Professional Rugby League and Australian Football. Journal of Strength and Conditioning Research, 1. https://doi.org/10.1519/jsc.0000000000003613
- (2019). FIFA Quality Performance Reports for EPTS. Retrieved June 17, 2020, from Football Technology website: https://football-technology.fifa.com/en/media-tiles/fifa-quality-performance-reports-for-epts/
- GNSS, E. (2019). Galileo and EGNOS featured at InterGeo 2019. Retrieved June 17, 2020, from Newsroom website: https://www.gsa.europa.eu/newsroom/news/galileo-and-egnos-featured-intergeo-2019
Author Details
Sport Sci Dept.