
12 Mar Temporal pattern analysis of physical data using Sonra’s Segment Drills function
Introduction
Typical practice of player load monitoring is to report on the overall performance of an athlete, for example the total distance achieved in a session.
Such monitoring can be used for continuous player monitoring and for planning the intended physical outcome of future sessions.
Another method of reporting is to break a match into a fixed time/number of segments. For example, a football match could be divided into 18 five-minute segments (20 segments in total – 1 extra at the end of each half for additional time).
This method can be used to report match intensity in relation to time and identify high intensity durations, recovery periods or potential fatigue of a player.
This method has been used to identify recovery time between high intensity bouts within five-minute time periods in football [1]. Akenhead et al (2013) investigated accelerations and decelerations in five-minute segments in football matches to try and identify fatigue or a reduction in physical performance [2]. This shows there is awareness of this analysis technique, however it may be underutilised.
The main issue with gaining such information is that it can be a time-consuming task manually splitting an athlete’s performance into multiple segments.
For a football match, it would require a minimum of 200 manual splits to get information on each player for five-minute periods.
However, there is a function available in the STATSports’ Sonra software that enables automatic splitting of segments, which could significantly reduce the time taken to acquire such information.
Methods
The first step of splitting a session into segment drills is setting the criteria. This can be done by opening Sonra and selecting SETTINGS > DRILLS & HIBS.
This tab (Figure 1) includes a number of configuration options relating to Drills and High Intensity Bursts.
The fields that apply on this window include Segment Duration, which will split a drill into segments of the duration that is set and # Segments, which will split a drill into segments of the fixed number set.
Any desired segmented time period or fixed number can be selected i.e. five-minute/three-minute/one-minute segments.
However, it is worth noting that shorter the time period in each segment or the larger the number of fixed number of segments selected, the longer the segmenting process will take as the system will be required to create more drills.
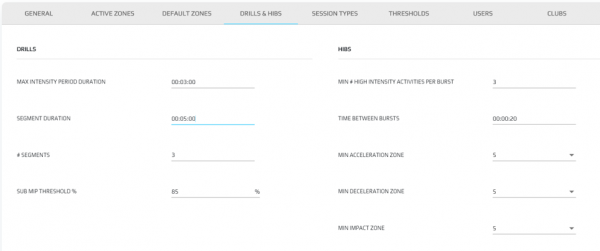
Figure 1. Configuration settings for segment drills feature within Sonra.
Once the segments have been configured, the session, drills (first half & second half), and a player must be selected.
It is important that drills for the first and second half are created as opposed to one drill for the full match as running the segment drills function on a full match drill will include data for the half-time period and the initial segment for the second half will not be synchronised with the actual start time of the second half.
It is also important that the first and second half drills are created with precision to the exact starting point to maintain accuracy. In order to execute the segment drills function, select the “More Actions” icon represented by the vertical ellipsis (⋮) > SEGMENT DRILLS > FIXED TIME DRILLS or FIXED NUMBER DRILLS (Figure 2).
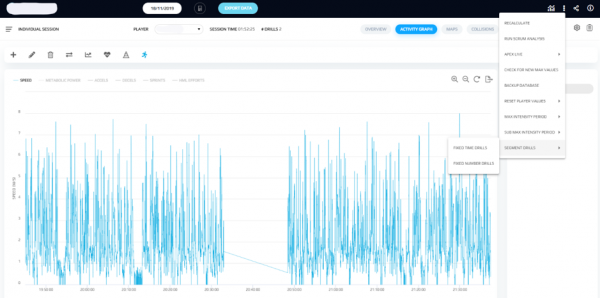
Figure 2. The steps required to apply segment drills to a player.
Once the process of splitting the drills into equal segments is complete (<1 min to split five-minute segments), the segmented drills will appear in the DRILLS section located on the right hand side of the software interface and can be applied to the relevant players that were also involved in the session.
This can be completed through the DRILL EDITOR by adding players from the All Players section to the Drill Players section. Once the relevant players are selected, click SAVE to apply your changes (average time to apply 20 five-minute segment drills to 13 players is <30 seconds).
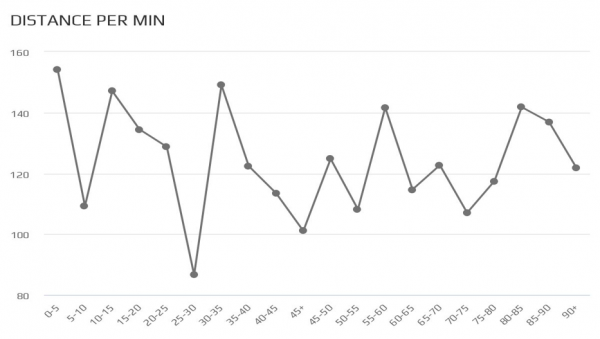
Figure 3. Example metric chart in Sonra showing the distance per minute covered by a single player across five-minute time periods (excluding HT).
Once the five-minute segments have been applied to all relevant players, the data can either be viewed within Sonra or be exported to a spreadsheet programme such as Microsoft Excel for further analysis and visualisation.
To do this, simply ensure that you have your preferred session and players selected then navigate to the EXPORT DATA button. From here, you can decide whether to use a default csv or a user-created template.
Lastly, select the drills you would like to export and hit GENERATE. Once the export is complete, the data can be manipulated for reporting.
Practical Applications
An example report could be looking at the total distance each player achieved in each five-minute segment (Figure 3).
The information portrayed in Figure 3 can provide coaches with an intensity timeline over a period of the game through conditional formatting of each cell; yellow – low intensity, green – moderate intensity, red – high intensity.
The intensity thresholds would be at the practitioner’s discretion and could be applied as absolute or relative.
It would be advised to collect data for several matches in order to understand what a low, moderate and high intensity period consists of for a selected metric.
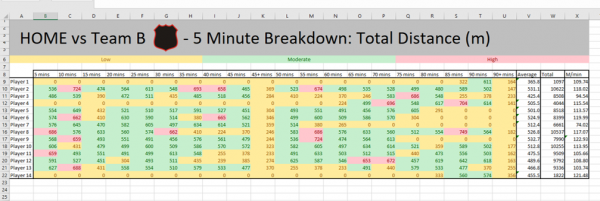
Figure 4. Example segment report showing the total distance covered by each player in five-minute time periods.
This report can give details on game intensity for each player/the whole squad for specific time periods. The report could also be used to identify long durations of high intensity activity without recovery periods which could be useful for coaches when planning recovery sessions on days following a game.
The report could also be used to identify a player’s work rate during key moments of a game, or whilst implementing a particular tactic.
An example game scenario of this could be if a team is losing a game and the coach has decided to run a high press in the last 20 minutes to try and win possession quickly.
Viewing the segmented time periods for metrics such as acceleration, sprints, high speed running or high metabolic load distance (HMLD) could identify how hard the attacking players worked in the last 20 minutes.
Future Developments
Being able to view the information shown in Figure 3 in real time may be beneficial, especially in sports that allow rolling substitutions such as Hockey, Ice Hockey, American Football and Basketball.
Viewing this data live could help inform coaches of when players have undergone long durations of high intensity activities without sufficient recovery time which could encourage a tactical change.
An example of this could be viewing time segments of HMLD in basketball, or collision load in American football. A potential future development for STATSports’ real-time tracking system may be to implement this type of analysis.
References
- Bradley, P. S., Sheldon, W., Wooster, B., Olsen, P., Boanas, P., & Krustrup, P. (2009). High-intensity running in English FA Premier League football matches. Journal of Sports Sciences, 27(2), 159-168.
- Akenhead, R., Hayes, P. R., Thompson, K. G., & French, D. (2013). Diminutions of acceleration and deceleration output during professional football match play. Journal of Science and Medicine in Sport, 16(6), 556-561.