21 Feb The Effect of Movement Speed and Angle on Dynamic Stress Load
Introduction
Advancements in technology have enabled global positioning system (GPS) devices to be equipped with additional sensors, one of which is an accelerometer.
Accelerometers provide force measurement across three axes; vertical (y-axis), medial-lateral (x-axis) and anterior-posterior (z-axis), known as a tri-axial accelerometer.
Having access to such data can allow measurement of force (G) exerted by or acting on the body, which has added another dimension to player monitoring and led to the creation of accelerometer derived metrics, such as STATSports’ Dynamic Stress Load (DSL).
DSL is the total of the weighted impacts of magnitude above 2G. It weights the impacts using a convex-shaped function with the key concept being that an impact of 4G is more than twice as hard on the body as an impact of 2G.
The weighted impacts are totalled and finally scaled to give more workable values. As DSL is a mechanical metric, it may be highly influenced by running technique.
Running at different speeds and angles of movement could also produce different DSL values. The aim of this study is to compare DSL between participants, and across a range of movement speeds and angles to identify what causes DSL to increase.
Methods
Two male athletes participated in the study (height 177 cm ± 4 cm, weight 76 kg ± 4 kg). Each participant performed 28 movements split over 20 m and 60 m distances.
The participants had not performed any previous activity within seven days prior to participating in the study to ensure fatigue was not a factor.
Distances were measured using a trundle wheel and marked using a cone (grey cone = 20 m, black cone = 60 m).
For each repetition participants stood stationary at the white cone, made light movement (< 2 m/s) to a black cone (3 m), completed a high intensity bout to the intended cone and finally become stationary for 3 seconds to end the repetition (Fig 1).
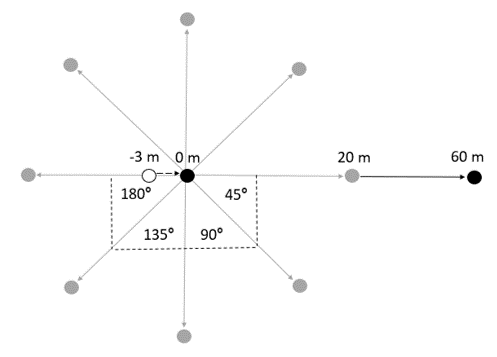
Fig 1. Diagram of the testing procedure. Linear bouts were completed from black cone (0 m) to black cone (60 m), and cutting manoeuvres were completed from black cone (0 m) to grey cone (20 m).
Twelve linear bouts with intensities ranging from moderate to maximal effort were performed over 60 m. The intensity zones were calculated from the participants’ max speed which was known prior to the study:
- 3 x Moderate 60-69% (≥ 5.3 < 6.2 m/s)
- 3 x Moderate-High 70-79% (≥ 6.2 <7.1 m/s)
- 3 x High 80-89% (≥ 7.1 < 8 m/s)
- 3 x Maximal Effort 90-100% (≥ 8 m/s)
Sixteen cutting manoeuvres were performed at maximal effort over 20 m:
- 2 x 0° (linear)
- 4 x 45° cutting manoeuvre (2 x left, 2 x right)
- 4 x 90° cutting manoeuvre (2 x left, 2 x right)
- 4 x 135° cutting manoeuvre (2 x left, 2 x right)
- 2 x 180° cutting manoeuvre
A recovery time of 90 seconds was given between repetitions for linear bouts and 60 seconds between repetitions for cutting manoeuvres to minimise central nervous system (CNS) fatigue.
Results & Discussion
The study showed that there is large variation in DSL between both participants in each activity (Fig 2 & 3).
DSL variations may be due to an individual’s running technique, which can vary a great deal between athletes.
Although running technique between athletes can be similar, it will remain unique. This suggests DSL may be a useful mechanical metric for monitoring athletes on an individual basis, as both participants completed the same activities which contained the same distances and intensities yet produced large variations in results.
Positive correlation was found between the magnitude of DSL and the max speed achieved in each bout (Fig 2).
For both participants the moderate intensity bouts had the lowest max speed and DSL values. The maximal effort bouts registered the highest speeds and produced the largest DSL. This may be due to an increase in posterior force that is caused by an increase in speed (Tominaga et al, 2016).
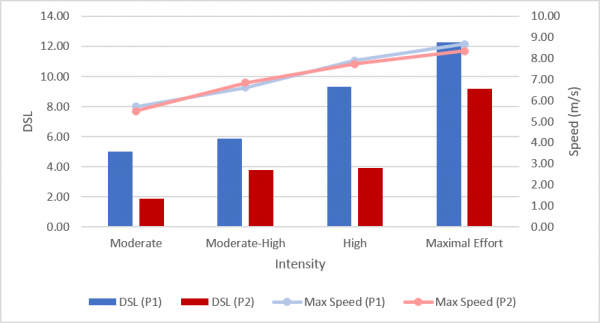
Fig 2. DSL During Linear Bouts (60m).
Mixed results were found between participants during the cutting manoeuvres. Participant 1 had similar DSL for 0°, 45° and 90° bouts, whereas there was an increase for 135° and 180° bouts (Fig 3).
Participant 2 however had similar DSL for 45°, 90°, 135° and 180° bouts and found a decrease during 0° bouts (Fig 3).
Again, this may be a result of the running style of an individual. Participant 1 may exert a larger force during foot-ground contact at the point of directional change of 135° and 180° as these movements require deceleration to a static state before accelerating in the new direction.
It may be an easier transition from linear to a direction at 45° or 90° for participant 1 as there is less deceleration required to make the directional change.
Body height, mass and shape could also influence running style whilst changing direction. Participant 2 has a larger body height and mass than participant 1 which may affect the ability to change direction as fluently during the 45° and 90° repetitions, requiring a larger force during foot-ground contact to transition into the new direction.
This could be the reason for similar DSL across 45°, 90°, 135°, 180° repetitions. This again supports the argument that DSL is unique to an individual and should not be compared with others as DSL values for particular movement for one individual could be different for another.
Due to the dependency of DSL on the running technique of an individual, further investigation could be directed towards comparing DSL in a fatigued and a non-fatigued state.
Clansey et al (2012) found an increase in vertical impact peak and Bazuelo-Ruiz et al (2018) found an increase in peak propulsion forces during a fatigued state, which suggests that fatigue will alter an individual’s running mechanics.
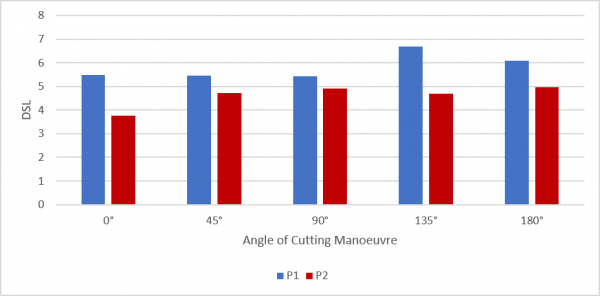
Fig 3. DSL During Cutting Manoeuvres (20m).
Conclusion
There is positive correlation with an increase in DSL values and max speed. If a session is designed to have high intensity activity, it is likely to see an increase in an individual’s DSL.
Running technique also plays a large factor in the generation of DSL for an individual, as such large differences were found when the two participants completed the same activities.
Cutting manoeuvres can also increase DSL, however two athletes completing the same movement, won’t always produce the same DSL values.
This may be because an individual’s height, mass and body shape will affect the ability and technique of changing direction. This also supports that DSL can be used as an indicator of mechanical load, however emphasises the importance of monitoring on an individual basis.
References
Bazuelo-Ruiz, B., Durá-Gil, J. V., Palomares, N., Medina, E., & Llana-Belloch, S. (2018). Effect of fatigue and gender on kinematics and ground reaction forces variables in recreational runners. PeerJ, 6, e4489.
Clansey, A. C., Hanlon, M., Wallace, E. S., & Lake, M. J. (2012). Effects of fatigue on running mechanics associated with tibial stress fracture risk. Medicine and Science in Sports and Exercise, 44(10), 1917-1923.
Tominaga, R., Ishii, Y., Ueda, T., & Kurokawa, T. (2016). The effects of running speed on ground reaction forces and lower limb kinematics during single-leg stop movement. The Journal of Strength & Conditioning Research, 30(5), 1224-1230.