
15 Jul Understanding the internal-external load relationship with STATSports’ Apex
Introduction
The main goal of the coaching staff is to optimize performance through the administration of an optimal training dose and an appropriate recovery period that allows psycho-physiological adaptations to reach optimal levels prior to competition.
There are different methods to monitor the intensity and volume of trainings and matches, among which are: Heart Rate monitoring (HR), GPS and subjective perception of effort (RPE).
All these methods have been used in team sports, providing information to evaluate the distribution of training loads.
Training load can be described as either internal and/or external, depending if we are referring to a measurable aspect that occurs internally or externally to the athlete (Impellizzeri et al., 2019).
External load is an objective quantification of the work done during training, such as distance covered, number of acceleration and decelerations, max speed achieved, or metabolic power expressed.
The Internal Load is represented by the response of the sum of psychophysiological stress derived from the external load.
Measures of internal load include heart rate-based variables, lactate concentrations or perception of effort.
Monitoring training load in team sports is complex, due to different playing positions with unique demands and the widespread use of group exercises with the ball.
Consequently, the response to training (internal load) to a specific load imposed (external load) may be considerably different between players.
This information is essential for the coaching and performance staff, since extreme training doses (minimal or excessive responses), can lead to a negative adaptation and a reduction in the performance.
Only through a systematic daily and weekly monitoring of the athlete’s response to a specific training programme can the coaching staff have enough information to guide and plan the training process over time.
The STATSports Apex system enables the practitioner to evaluate the training status of the athlete and combine sources of information from heart rate monitors, GPS and the inertial sensors.
Practical Applications
STATSports SONRA software offers several options to help track an individual athlete’s adaptations to training.
A player presenting higher internal load data compared to his usual performance to a standard external load session may indicate signs of fatigue or reduced fitness.
By contrast, a lower score is a sign that the athlete is in a good psychophysiological state (Impellizzeri et al., 2019).
Heart Rate-based metrics included in the software are: Average Heart Rate, Heart Rate Variability, Max Heart Rate, time in specific heart rate zone (Zone 1 to 6, which are all customizable), Heart Rate Exertion and Heart Rate Load.
Heart Rate Exertion (HRE) is a weighted score which represents the total volume of cardiovascular exertion that the participants experience during exercise.
The closer the recorded Heart Rate is to the Heart Rate max, the greater the associated weighting score. Each of the resulting weighting scores is then multiplied by the duration of exercise (in seconds).
These individual scores are then summed to give an overall HRE score for the entire duration. HRE has been investigated in Tang et al. study (2018), which was found to be significantly greater for sessions involving greater frequency of accelerations and decelerations and when more directional changes were performed.
Other valid methods for quantifying internal training load have been used by practitioners, such as the calculation of the training impulse (TRIMP) through the heart rate zones during training sessions.
The TRIMP method, based on the heart rate measurement, was proposed by Banister (1991) and later adapted by Edwards (1993).
The Edwards method (1993) determines internal load by measuring the product of the accumulated training duration (minutes) in 5 Heart Rate zones by a coefficient relative to each zone (50–60% of HRmax = 1, 60–70% of HRmax = 2, 70–80% of HRmax = 3, 80–90% of HRmax = 4, 90–100% of HRmax = 5) and then summing up the results to give a score.
With the Edwards method, it is possible to check the distribution of work intensity throughout the entire training session and the time spent at high intensity to generate specific cardiovascular adaptations at the aerobic level.
This metric can be easily created within the SONRA software. Once we have individualized the HR Max of the athletes with an incremental test and customized the heart rate zone in the player settings, the Edwards Method can be added as a new Internal Load metric through the CUSTOM METRIC CALCULATOR with a simple formula and compared with external load parameters with the COMBO CHART (Fig 1).
The analysis can be done for an individual player over a period of time (INDIVIDUAL PERIOD), between drills for a single players (INDIVIDUAL SESSION), between players in a single session (SESSION) and as team over a period of time (SQUAD PERIOD).
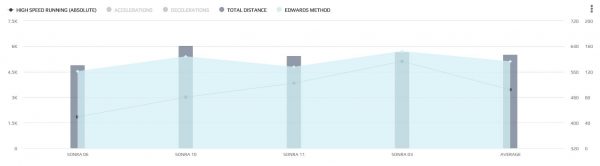
Figure 1. Example of an External and Internal load comparison between players in a single session
The activity graph is another effective feature in SONRA which provides an overview of the session through the visualization of the heart rate trace in comparison with external load parameters.
The metrics displayed in the activity graph (Fig 2) can be toggled on and off, allowing the user to visualize a trend within a session.
This might be of particularly importance on match day where a large decrement in the average speed might still be associated with a higher heart rate, suggesting a decline in performance that should be taken into consideration by coaching and support staff when planning future training and recovery protocols.
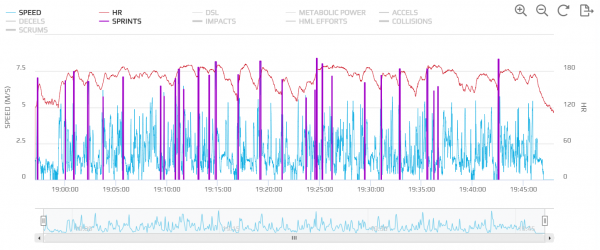
Figure 2. Activity graph showing the speed profile of the session, along with HR trace and Sprints in the first half of a soccer game.
Practical Considerations
Each athlete responds differently to any given training dose, therefore monitoring internal and external load in unison can provide objective and subjective information on the impact that a session has had on a player.
STATSports technology will continue to evolve to allow users to utilize new features and new analytical tools for an easy and accurate interpretation of the workload, which can ultimately enhance athletic performance and minimize the negative effect of training.
Author Details
Alberto Silingardi
Sport Scientist
References
- Banister, EW. Modeling elite athletic performance. In: Physiological Testing of Elite Athletes. H. Green, J. McDougal, and H. Wenger, eds. Champaign, IL: Human Kinetics, 1991. pp. 403–424.
- Edwards, S. High performance training and racing. In: The Heart Rate Monitor Book, S. Edwards (Ed.). Sacramento, CA: Feet Fleet Press, 1993, pp. 113–123.
- Impellizzeri FM, Marcora SM, Coutts AJ. Internal and External Training Load: 15 Years On. Int J Sports Physiol Perform. 2019 Feb 1;14(2):270-273. doi: 10.1123/ijspp.2018-0935. Epub 2019 Jan 6. PubMed PMID: 30614348.
- Tang, R., Murtagh, C., Warrington, G., Cable, T., Morgan, O., O’Boyle, A., Burgess, D., Morgans, R., & Drust, B. (2018). Directional Change Mediates the Physiological Response to High-Intensity Shuttle Running in Professional Soccer Players. Sports (Basel, Switzerland), 6(2), 39. https://doi.org/10.3390/sports6020039