26 Sep Who are the fastest players at the Rugby World Cup 2019?
With the Rugby World Cup in Japan well and truly underway. It’s already evident that players are fitter and faster than we’ve ever seen in previous tournaments. But in pubs around the country, one question will be constant. If you had to back someone in an out and out footrace, who would it be?
We think we have the answer.
Max Speed
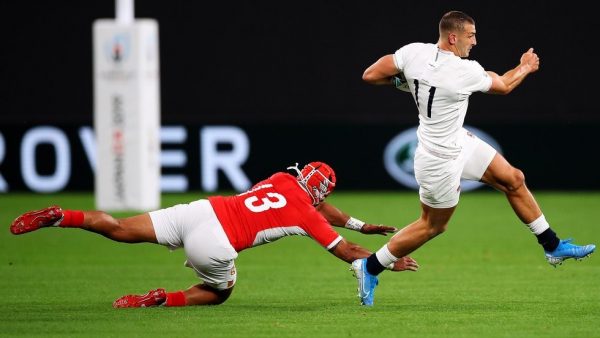
Arguably the fastest man to pull on the England shirt, Jonny May, should be high on anybody’s list. May, who is renowned for making teams regret giving him a meter of space, has clocked a 37.71 km/h max speed.
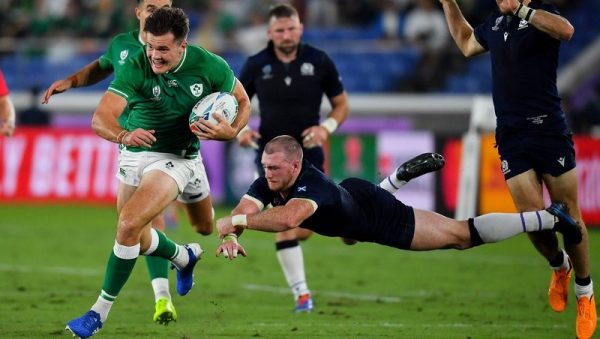
Close behind is Ireland’s Jacob Stockdale. With a max speed of 35.89 km/h, it’s no coincidence that he has scored 16 international tries in 22 games. At 6ft 3, Stockdale is probably just as likely to fend you off and score, than he is to pace you on the outside.
Average Speed
But max speed only tells half the story. How you maintain that speed throughout your sprint shows the quality of the athletes on show at the Rugby World Cup. The elusive Cheslin Kolbe can maintain an average speed of 33.66 km/h during one of his famous sprints up the touchline, only 3.92 km/h shy of Usain Bolt’s average speed when he smashed the 100m world record in Berlin ten years ago. The France center, Virmi Vakatawa isn’t far behind with a 32.02 km/h average speed. Not bad for a man carrying nearly 15 stone in muscle. There may be a few backlines left shouting “Your man” when Vakatawa is carrying the ball during this Rugby World Cup.
Cheslin Kolbe is slipperier than a buttered otter ⚡️
What a talent ⭐️#RWC2019 #NZLvRSA #RWCYokohama pic.twitter.com/cYMZKvoKh6
— Rugby World Cup (@rugbyworldcup) September 22, 2019
Max Speed by Position
The average max speeds will vary considerably across each position in a rugby team. During a Rugby World Cup, the margins are so small that defense is absolutely key. As the old saying goes “defense wins championships”. In this tournament more than most, the ability for an attacking player to find a mismatch in a defensive line could be the difference between winning and losing a game, and in some cases a group. The average max speeds per position gives us statistical evidence that despite the athleticism of players throughout the Rugby World Cup squads, the opportunities to make that game winning line break still exist.
Average max speed of a fullback: 33.48km/h
Average max speed of a winger: 33km/h

Average max speed of a number 8: 27.43km/h

Average max speed of a hooker: 24.66km/h
Backs vs Forwards: Average distance per game
In rugby clubs across the world there are arguments about who works harder, backs or forwards. But when it comes to total distance covered during an 80 minute game? The backs edge it. A player in the backline will average 7.5km a game during the Rugby World Cup. Whereas a forward will cover 6km on average.
For some context in comparison to other sports, Basketball players will cover 4.3km, Soccer is 10km, and Cricket fast bowlers can do 20km a day. Although, the average weight of the Tonga forwards who started against England last Sunday was just over 19st. I think the scales might be tipped slightly against the rugby players in this instance.
Backs vs Forwards: Average impacts per game
The backs may cover more distance, but during this Rugby World Cup, forwards will make over twice as many impacts. The average backline will make 120 impacts per game, in comparison to 300 impacts per game per forward pack. This statistic will be even more evident during this tournament, as it is forecasted to have more ball in play time and more tackle situations than ever before.
Due to the scheduling of the tournament in Japan, which can have as short as a 4 day turn around for games. Combined with the increasing amounts of average impacts per game. It is absolutely vital for teams to monitor and manage player load during games and in training. For example, if a forward has made more impacts during a game than his positional average, this may be a reason to reduce the amount of impacts that player has for the following training sessions. This is an important step that coaches will be taking to prevent injuries.
Rugby Teams using STATSports, will be getting this player load data live to their laptops and tablets during games and training. Meaning they can make informed decisions, and manage their players based on accurate live data. As we’ve seen in previous Rugby World Cups, keeping your best players fit and injury free can be critical when progressing through the knockout stages.
STATSports at the World Cup
STATSports will be supporting 12 out of 20 teams at the Rugby World Cup 2019.

Years of in game data has given us a full understanding of what is required in the game defining moments. From the speed required to hit a contact and break a line, the line speed to make tackles, to the intensity to be successful.
Our data will give these teams at the Rugby World Cup the ability to adjust in real time, max intensity in training to replicate the game intensities, reduce fatigue and mitigate injury. Meaning that the players will be in the freshest possible state to perform at their best during the Rugby World Cup.
Request a Demo
If you are a coach who wants to improve your team’s performance and prevent injuries. Schedule a free demo our team series software from one of our expert sports scientists by clicking here.
If you are an individual rugby player who wants the same world leading technology that is used by over 500 elite teams around the world. You can purchase the Apex Athlete Series, allowing you to easily interpret your own training and game data through our iOS and Android app, without needing the support of elite sport scientists. How fast are you running, how much distance are you covering, find out by clicking here.