30 May Individualisation of Player Monitoring: Speed Zones – Part 1
GPS monitoring and analysis in professional sport has now become commonplace. The ability of sports scientists and coaches to obtain accurate time motion analysis, ground contact and heart rate data is relativity simple.
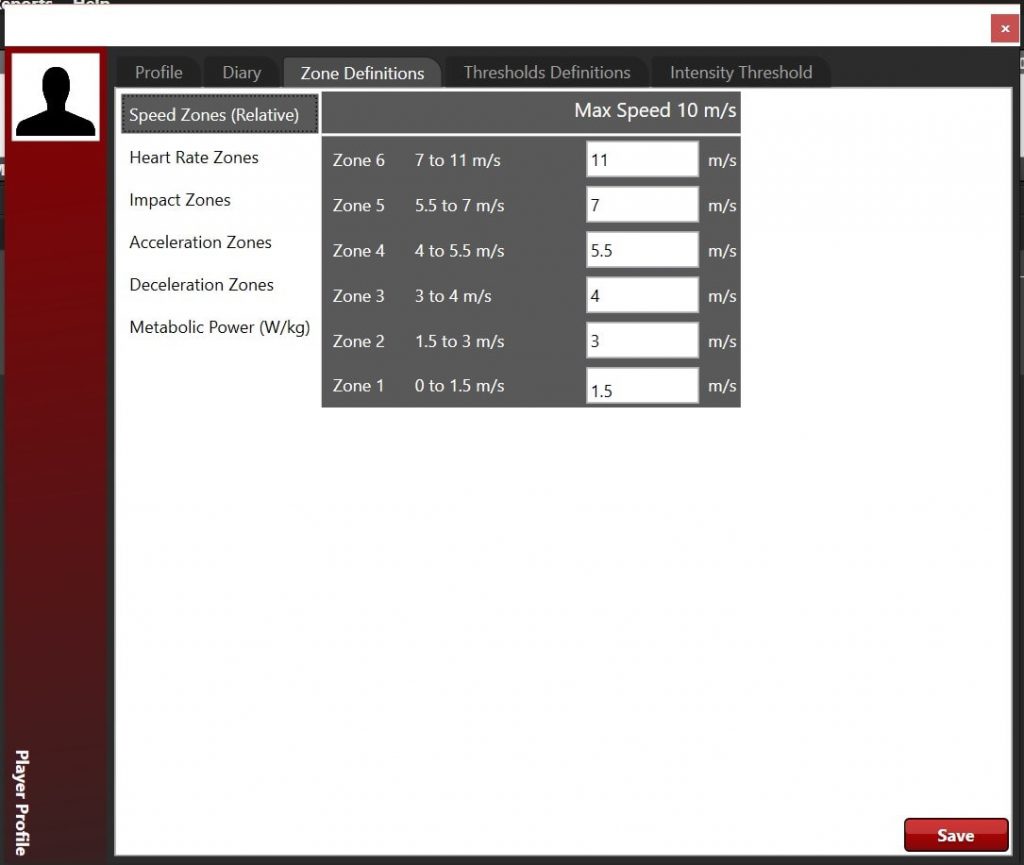
Determining the most effective way to apply this data, while avoiding common training load errors, is understandably a more complex process. Typically, in the development of an advanced approach to analyzing performance data, several initial setting preferences need to be configured. This blog post lays out the first and arguably most important setting configuration choice that occurs; the individualisation of player speed zones.
Speed zones within STATSports Viper software are set by default to an “absolute” value. This means that the values are fixed the same for each player, thus making them independent of any characteristics related to that player such as age, fitness levels & player status etc.
The ability to switch between team/group absolute and individual (Sometimes referred to as relative) speed zone setting preferences is a smart feature of the viper software. Which allows for a comparative analysis within and between players/ groups.
This decision to use absolute or individual speed zones influences the analysis process of key performance indicators (KPI’s) over an acute and longitudinal time period. Resulting in an indirect effect on other important data related to; load monitoring, return to play benchmarks, performance tracking and training prescriptions. An argument can also be made that this rippling effect may influence a team’s approach to preparation and performance.
Before I layout further considerations related to speed zones. It is important to define the difference between a Zone and a Threshold. These terms are commonly used interchangeably but they have distinct differences and although closely related they are not the same thing.
Firstly, a Zone is used to distinguish uniform information by its characteristics. In the case of a speed zone, for example, the incoming number (Speed m/s) is assigned to a zone based on the characteristics of its value, following a low to high pattern. Within the Viper system, all zones range from 1-6 in ascending order.
Conversely, a threshold is a definitive boundary, this can take the form of a start or end point. The viper system’s threshold feature is predominantly used to mark the start of an undesired accumulation of activity (Kinematic, Mechanical, Metabolic, and Cardiovascular). This isn’t always an over-accumulation of activity, as an under-accumulation is equally relevant in terms of load management and performance.
Another important and distinguishing feature of a threshold is its conditional nature, the combination of the session type, volume and intensity dictate the value of a threshold. Thus consistent subtle changes in threshold values should occur. A zone will typically only be subject to a change in conjunction with a player’s maturity or fitness levels.
Some of the documented rationale for individualized speed zones in journal research is outlined in the below table.
| Suarez-Arrones et al, 2012. | Determine position specific high speed running demands in rugby union. |
| Reardon et al, 2015. | Inform HSR training prescription and determine the rugby union positions specific demands upon individuals. |
| Gabbett, 2015. | Inform the individual training requirements of players and determine recovery volumes with greater accuracy. |
| Clarke et al, 2014. | To gather an individualized assessment of game demands to inform training prescription. |
| Anderson et al, 2016 | Informing individual nutritional requirements and strategies around varying weekly load demands. |
This is by no means an extensive review of the literature, but it does provide a useful starting point in evaluating the decision to use individualized zones in your performance structure. In Part 2 of this blog post, I will discuss the practicality and validity of current methods of calculating individual speed zones.
For more information on STATSports System contact us. Make sure to check out our Facebook, Twitter & brand new LinkedIn group.
References:
Anderson, L. Orme, P. Di Michele, R. Close, G. Morgans, R. Drust, B. Morton, JP. (2016). Quantification of training load during one-, two- and three-game week schedules in professional soccer players from the English Premier League: implications for carbohydrate periodization. Journal of Sports Science. 34 (13): 1250-9.
Clarke, A.C. Anson, J. Pyne, D. (2014). Physiologically based GPS speed zones for evaluating running demands in Women’s Rugby Sevens. Journal of Sports Sciences.
Gabbett, TJ (2015). Use of relative speed zones increases the high-speed running performed in team sport match play. Journal of Strength and Conditioning Research. 29 (12): 3353–3359.
Reardon C, Tobin DP, Delahunt E (2015) Application of Individualized Speed Thresholds to Interpret Position Specific Running Demands in Elite Professional Rugby Union: A GPS Study. PLoS ONE. 10 (7).
Suarez-Arrones LJ, Portillo LJ, Gonzalez Rave JM, Munoz VT, Sanchez F (2012) Match running performance in Spanish elite male rugby union using global positioning systems. Isokinetics & Exercise Science. 20: 77–83.
Mark Connor
Sports Scientist