
30 May Individualisation of Player Monitoring: Speed Zones – Part 2
In Part 1 of this blog post I discussed how a zone differs from a threshold, the difference in absolute and individual zones. And presented some rationale behind using individualized speed zones. In this post I introduce some of the common methods used to calculate zones, paying particular attention to the practicality and validity of each method used.
Percentage of maximum velocity (Vmax) is a common method used to determine the value of speed zones. This involves setting the start of a zone to the equivalent of an arbitrary percentage of Vmax (Table 1.0).
|
Velocity max/ Submax |
Percentage % |
Speed zone |
|
9.0 |
100 |
– |
|
8.55 |
95> |
Zone 6 |
|
7.65 |
85> |
Zone 5 |
(Table 1.0) Player’s Vmax and corresponding percentage at which the start of their individual speed zone is defined.
The following table provides an example of a player with a Vmax of 9.0m/s, thus equalling 100%, working back we can calculate a zone entry speed corresponding to a submaximal percentage. The choice of chosen percentage is typically at the discretion of the user and may be based on the assumption that at a certain percentage of Vmax would correlate to vVo2max or speed at the onset of blood lactate (OBLA)/ VT2.
This can be a flawed assumption considering the large variability in players Anaerobic Speed Reserves (AnSR) and the metabolic costs of running above Vvo2max (Blondel et al, 2001). See Chart 1.0 for an example of the variability in trained collegiate runners (Bundle et al, 2003).
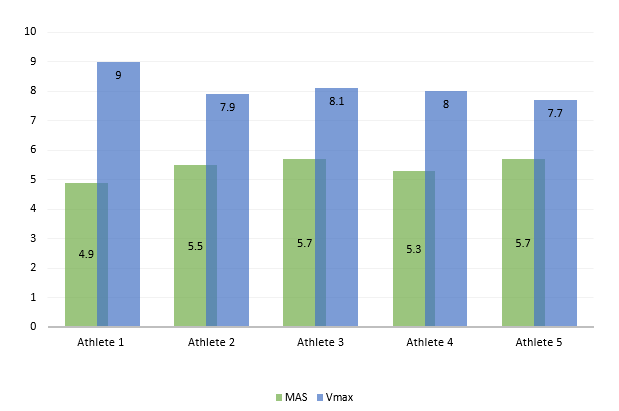
Chart 1.0 Velocity VO2max (m/s) & Max Anaerobic Sprint Speed (m/s) in trained college runners
However, this method may still provide a more detailed account of an individual’s physiological demands during training/ match play compared to default absolute speed zones. See Table 2.0 as an example.
|
Velocity max/ Submax |
Percentage % |
Speed zone |
|
9.0 |
100 |
– |
|
7.0 |
77.7% |
Zone 6 |
|
5.5
|
61% |
Zone 5 |
(Table 2.0) Player’s Vmax and corresponding percentage at which the start of their individual speed zone is defined.
If we compare the percentages of Vmax for each zone, individual and absolute (default) there is an 18% difference in the speeds required to achieve Zone 6 speed and a 24% difference for Zone 5. In the absolute table, the player has only to achieve 61% of their Vmax to achieve Zone 5 Speed.

Typically, this zone is considered as high intensity, an argument can be made however that this level of intensity (61% Vmax) may not elicit the acute physiological changes in blood chemistry and VO2 kinetics associated with high intensity activity.This argument however may only apply to a player with a high Vmax, the lower the Vmax a player has, the less the degree of error present.
In an attempt to ratify the error associated with variations in anaerobic speed reserves between players, data derived from common field-based performance tests can be used to assist in an estimation of the AnSR and thus provide a more accurate representation of player load.

Estimations of AnSR have been made in the literature (Blondel et al, 2001; Dardouri et al, 2014; by subtracting Maximal Sprinting Speed (Vmax) / Maximal anaerobic speed (MAnS), from the speed at VO2 Max (Vvo2 Max) calculated from scores achieved during a multi-stage fitness test variation.
AnSR(m⋅s−1) = MAnS(m⋅s−1) − vVO2max(m⋅s−1)
Through the use of this equitation and data gathered from common field-based fitness tests, typically performed in the pre-season training period a physiologically derived method of setting “High Speed Running” parameters can be applied. See Chart 2.0
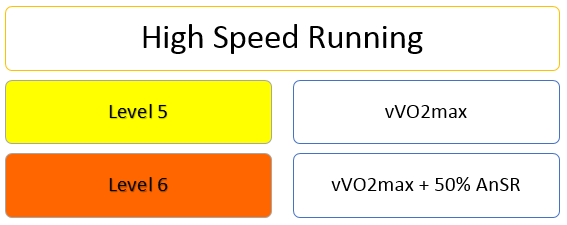
Chart 2.0 Speed Zone Parameters set of individual player physiological markers.
A modified version of this approach has previously been used in research by Mendez-Villanueva et al, (2013) during a study on Match play intensity distribution in youth soccer. Other approaches adopted have included the use of lab-based tests to determine zone boundaries based on biochemical and kinematic markers. Abt and Lovell (2009), used an individualized high-intensity speed threshold based on Speed at the second ventilatory threshold, compared to a prozone default speed zone at 19.8km-1.Chart 2.0 Speed Zone Parameters set of individual player physiological markers.
The results showed the high-intensity running speeds based on VT2 were substantially less than the default ProZone absolute speeds. This approach has since been adopted by a range of academics such as Clarke et al, (2014). Using 5Hz GPS units, they compared distances for high speed running at 3 different thresholds; absolute (5m/s), Mean VT2 and Individual VT2. The results showed that using 5m · s−1 as the threshold for high-intensity running underestimated the mean amount of physiologically demanding work that is performed by (Female Rugby) players during games.
An argument can be made however that speed at VT2 is not a high enough boundary to mark the start of acute bouts of high intensity running. Speed in and around VT2 can be maintained for 30-60 minutes in well-trained athletes. But as we know field sports are typically categorized by intermittent bursts of very high-intensity activity.
This may explain the underestimation of high speed running demands when using an individual or mean group VT2 speed when compared to absolute system defaults. VT2 may be a beneficial threshold marker in middle to long distance running but can lack some ecological validity in team sports.
In conclusion, several methods of setting high-intensity boundaries exist in time motion analysis technology. And it seems each holds some positive and negative aspects. Regardless of the method used consistency must always be present and the data gathered should be viewed in a holistic manner in relation to players’ fitness, performance, and recovery.
For more information on STATSports System contact us. Make sure to check out our Facebook, Twitter & brand new LinkedIn group.
References.
Abt, G., & Lovell, R. (2009). The use of individualized speed and intensity thresholds for determining the distance run at high intensity in professional soccer. Journal of Sports Sciences. (27): 893–898.
Blondel, N. Berthoin, S. Billat, V. Lensel, G.(2001). Relationship Between Run Times to Exhaustion at 90, 100, 120, and 140% of vVO2max and Velocity Expressed Relatively to Critical Velocity and Maximal Velocity. International Journal of Sports Medicine. 22: 27-33.
Bundle, M.W Hoyt, R.W. Weyand, P.G. (2003). High-speed running performance: a new approach to assessment and prediction. Journal of Applied Physiology. 95(5):1955–62
Clarke, A. Anson, J. Pyne, D. (2014). Physiologically based GPS speed zones for evaluating running demands in Women’s Rugby Sevens. Journal of Sports Sciences.
Heaney, N. (2013). The efficacy of utilizing the anaerobic speed reserve to prescribe supramaximal high-intensity interval training. Conference: 2013 International Australian Strength and Conditioning Association.
Maughan, R.J. (2013). The Encyclopaedia of Sports Medicine: An IOC Medical Commission Publication. International Journal of Sports Medicine. 34(2):101-10.
Mendez-Villanueva, A. Buchheit, M. Simpson, B. Bourdon, PC. (2013). Match play intensity distribution in youth soccer.
Weyand, P.G. Bundle, M.W. (2005). Energetics of high-speed running: integrating classical theory and contemporary observations. American journal of physiology. Regulatory, integrative and comparative physiology. 288(4):956–65.
Mark Connor
Sports Scientist