08 Jul Integrating GPS and Video Analysis: Applications of the Sonra Video Manager
Introduction
Match running demands in soccer have been well documented, with a plethora of literature available across various leagues and time periods [1,2].
In elite competition players typically cover between 10 and 12 kilometres in total distance per game, which is relatively consistent over time.
Despite this, the high-intensity efforts completed is increasing, meaning players are expected to perform more explosive activities than in previous years [3].
Understanding game demands is critical in training prescription, and match running performance is often utilised by practitioners to inform the load monitoring strategies throughout a training cycle.
However, despite the wealth of literature available on game demands, studies investigating the influence of tactical or technical actions have on the overall physical demands are a relatively new concept.
All physical activity completed during a soccer match will have an associated tactical or technical purpose, and as such, should be accounted for in an analysis of the physical demands of match play.
Ade et al [4] demonstrates the technical and tactical actions associated with high-intensity movements and offers an innovative approach into drill design, while recent publications from Bradley et al [5,6] have expanded on the concept of a more integrated approach into match analysis.
Video Manager
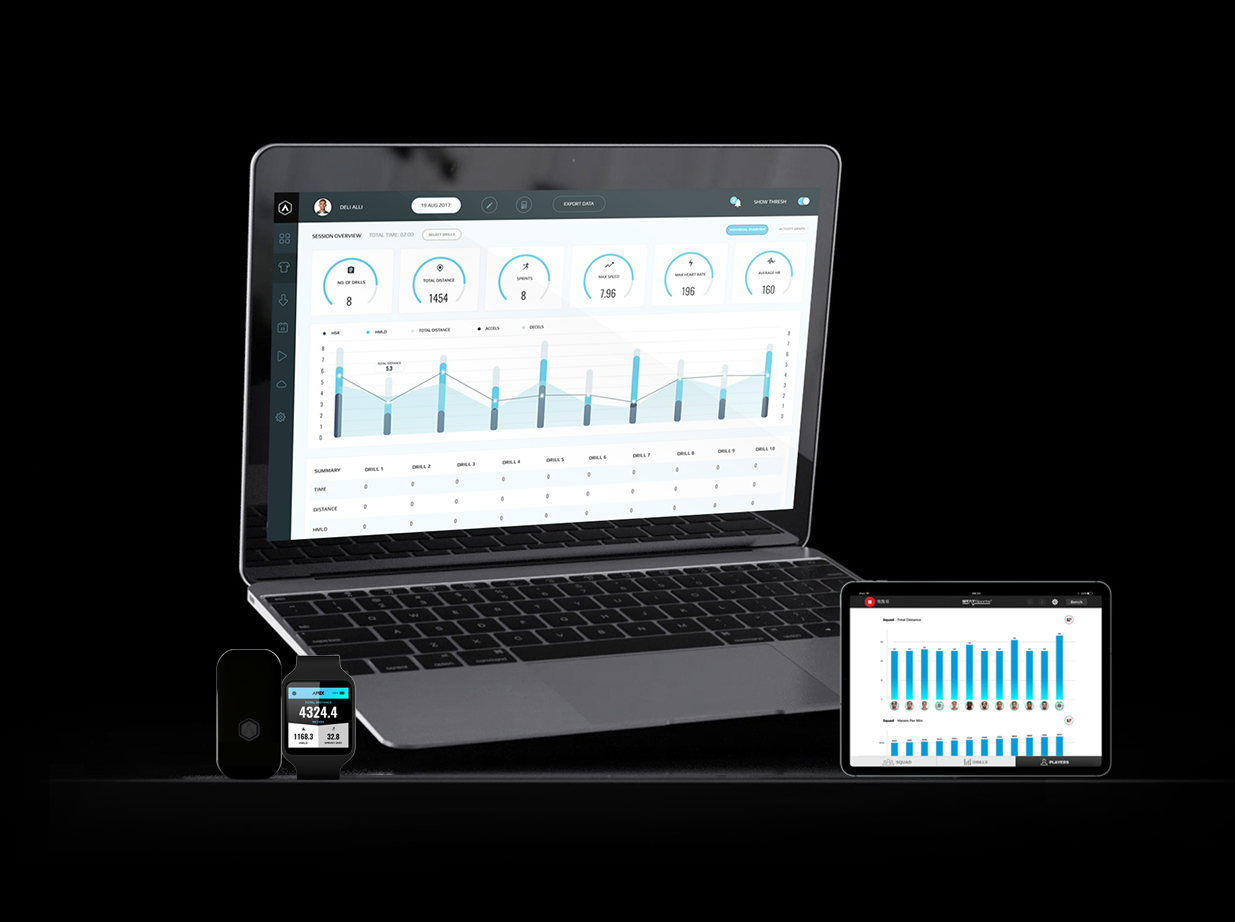
The Sonra Video Manager is a platform designed to streamline the integration of video analysis and physical data.
Previously, extracting coded event data from video analysis platforms and generating physical reports from tracking data was a time-consuming and arduous task.
The Video Manager features a dual timeline to view event data (tactical/technical tags) in relation to the physical output for a specified time period.
Tags can be generated within the platform itself or imported via a 3rd party system. The generation of physical reports from a row of tags can be completed in minutes, making an integrated approach to match analysis more accessible to coaches and practitioners.
This article will detail; 1). The process of synchronising video and applications of the synchronised timeline, 2). Tag generation and third-party imports for video review and producing physical reports for tagged events, and 3). Incorporating the integrated match data into drill design.
Video Synchronisation
Accurately synchronising the elapsed video time with the GPS time-motion data is critical to extract physical metrics for specified sequences in the video data.
Physical metrics are derived from time-motion data, and a misalignment in -the data sets would result in inaccuracies in the integrated reports.
In order to simplify the process of synchronising GPS and event data, the Video Manager introduces a single-click solution to quickly and accurately synchronise GPS and video data.
In the video above, physical data is presented for the player in black on the left side of the centre circle prior to kick-off.
As the player begins to press, the activity graph reflects the movement speeds of the player.
By pausing the video at a known point in the press, users can select the sync point on the activity graph (red line) to adjust the synchronisation to the correct time.
Once video sync has been achieved, users can then use the event tags of the activity graph (accelerations, decelerations, sprints, impacts, HML efforts) to recall physical events in the video.
For example, viewing sprints on the activity graph (purple box) allows coaches to view the footage of these actions and gain an understanding of the nature of a particular sprint, rather than focusing on physical values in isolation.
In the videos below, sprints are selected on the activity graph for video recall. The player in focus is the left wing back in white, who is the player immediately to the foreground near the halfway line at the start of video 1, and on the halfway line in video 2.
Using video recall, we can see that sprint 1 was performed to complete an overlap and sprint 2 was a recovery run.
Practitioners will often look to identify the most physically demanding period or the ‘worst case scenario’ in match play and use their understanding of these high-intensity bouts to inform conditioning drills.
Within the Sonra software, the identification of ‘worst case scenarios’ is automated using the Max Intensity Period (MIP) function. MIP’s identify the time period with the highest accumulation of a specified metric over a user-defined time period.
By integrating MIP analysis with video feedback, coaches can determine the match impact of a player’s MIP and potentially utilise this information to recreate scenarios that are demanding both physically and technically in training.
In the video example below, an MIP was calculated for the left wing back in the previous examples, using the High Speed Running metric (distance covered >5.5 m/s) for a duration of 1-minute.
In the MIP, there are effectively two high-intensity bouts, the first being a defensive recovery run, and the second involving a turnover of the opposition and a subsequent forward drive leading to a goal-scoring opportunity.
Tag Integration
Following the synchronisation of GPS and video, tags can be integrated into the Video Manager for analysis with a greater focus on the tactical and technical factors of the game.
Tags can be generated within the Video Manager platform natively to tag a full session or to edit an existing timeline from a third-party import.
Tags are fully customisable and can be configured to operate off a single-click with custom lead and lag times, or a click-on and off manual setup for tags which will require more specific start and end times of an event, such as possession status.
Generated tags will populate on the tag portion of the dual-timeline and synchronise with the selected view of the activity graph/physical data.
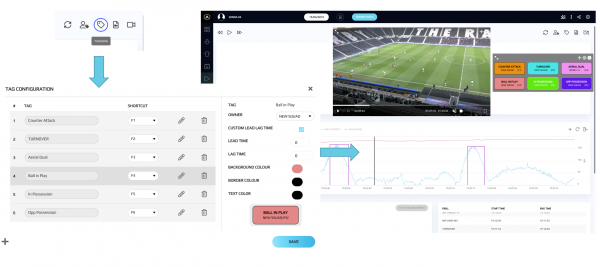
Figure 1. Setup of a coding window in the Video Manager platform.
Tags can also be quickly imported by any third-party video analysis or event tagging system via XML.
The tag rows within an XML can be assigned to specified players, groups or squads on import on an individual tag row level.
Alternatively, all tag rows within an XML can be assigned to a single player, squad or group where appropriate.
Third-party tags will also populate the tag portion of the dual-timeline in synchronisation with the activity graph.
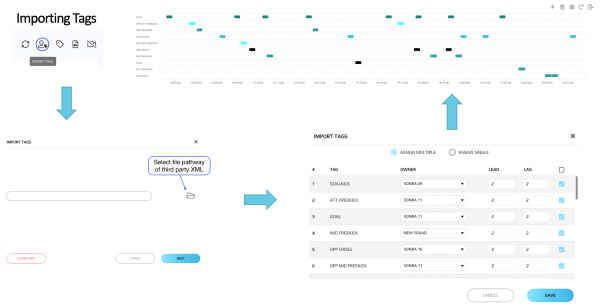
Figure 2. Third-party tag import.
Tags on the dual timeline are unique in that they can be used to create drills from the synchronised physical data to produce reports for specified tags.
Users can select an entire tag row for any tag, or individual tag instances, and create a physical report for the relevant actions (Figure 3).
For example, selecting a tag row for ‘Ball-in-Play’ will produce a report on physical output during periods of play only.
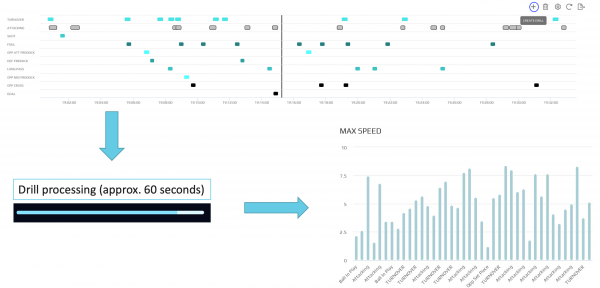
Figure 3. Creating drills from the tag timeline.
Adding tactical context to physical data can improve our understanding of a player’s role in a team and the nature of the high-intensity efforts they may be involved in during match play.
For example, Figure 4 compares the High Speed Running demands of two midfield players during 45-minutes of match play.
Both players performed a similar volume of High Speed Running and, by incorporating the positional data, we can see that the sprints performed by Player A were frequently performed in defensive areas, while Player B performed sprints in the oppositions half.
However, further context is added by creating drills from tags relating to possession status. From this, it is evident that Player B performs the majority of their High Speed Running while in possession, being less active when the opposition have the ball.
In contrast, Player A typically performed High Speed Running while the opposition were in position or the ball was out of play. These runs were usually for pressing or recovering position.
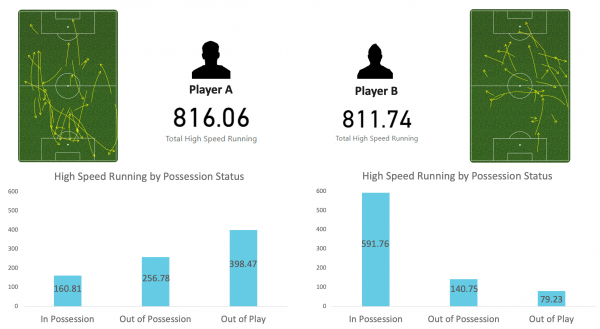
Figure 4. Comparison of High Speed Running metres between a defensive (player A) and offensive (player B) midfield player.
Incorporating Match Data into Drill Design
The tag timeline can also be used for video recall of specific tags.
Practitioners can use video key moments of a match from the tagged data; be that a goal scoring opportunity, a defensive recover or even an event leading to an injury, in order to document the physical data from the event and potentially utilise this data in the planning and delivery of training drills.
In the example below, the tag timeline is used to view a turnover completed by the left wing back and a subsequent forward drive which, followed by a second turnover/forward drive, leading to a goal (High Speed Running MIP referenced previously).
Focusing on the left wing back in the examples, turning over the opposition and completing forward, counter-attacking runs are a key aspect of this player’s positional role.
Utilising the tag timeline, the most successful period of play (and most demanding High Speed Running sequence) was identified.
This period can be used to model performance and recreated on the training ground. Using the tag to create a drill, the information in Figure 5 was extracted.
The positional map indicates the players movement through the colour-scale of the 6 speed zones (Zone 1 – Blue [0-1.5 m/s], Zone 6 – Red [7-11 m/s]), while the table of information is the physical output during the sequence.
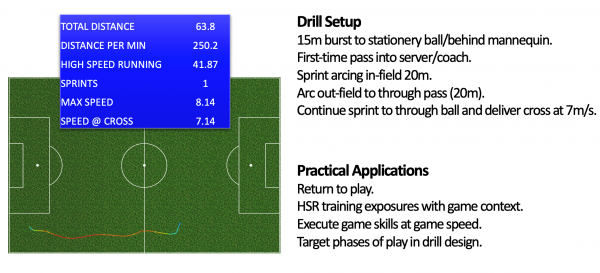
Figure 5. Extracting physical data from an event tag for drill design.
This data can be used to complement the coaches input on recreating this specific phase of play, as laid out in the drill set up in Figure 5.
Real time analysis via the Sonra Live iPad or the Apex Live Apple Watch applications can ensure the benchmarked target is achieved per repetition.
Practitioners will have the ability to target a set amount of High Speed Running meters per repetition, a minimum requirement for max speed exposure, and a targeted speed for the cross/delivery.
Utilising this approach in drill design may have implications in the return to play process and ensuring athletes can cope with game-specific actions before their reintroduction to full training, and also aid in position specific training for high speed exposures in a game context.
Conclusion
With a large uptake in the use of technology and data across professional sports, there is an increased need for integration across the various platforms utilised by elite teams.
Coaches and practitioners are becoming increasingly innovative in how they interact with technology and utilise it to gain a competitive edge.
The Sonra Video Manager was designed to facilitate practitioners to view physical data through a technical/tactical lens.
The integration of physical and event data is a logical progression in athlete monitoring and shows great promise in influencing how we understand the demands of competition and how these demands may aid or inform training strategies.
References
- Di Salvo, V., Gregson, W., Atkinson, G., Tordoff, P., and Drust, B. (2009). Analysis of high intensity activity in Premier League soccer. International Journal of Sports Medicine, 30, (3), 205 – 212.
- Bloomfield, J., Polman, R. & O’Donoghue, P. (2007). Physical demands of different positions in FA Premier League soccer. Journal of Sports Science & Medicine, 6, (1), 63 – 70.
- Bradley, P., Archer, D., Hogg, B., Schuth, G., Bush, M., Carling, C. & Barnes, C. (2015). Tier-specific evolution of match performance characteristics in the English Premier League: it’s getting tougher at the top. Journal of Sports Sciences, 34(10), 980 – 987.
- Ade, J.D., Fitzpatrick, J. and Bradley, P.S. (2016). High-intensity efforts in elite soccer matches and associated movement patterns, technical skills and tactical actions. Information for position-specific training drills. Journal of Sports Sciences, 34, (24), 2205 – 2214.
- Bradley, P.S., Evans, M., Laws, A. and Ade, J.D. (2018). ‘Context is King’ when Interpreting Match Physical Performances, Medic & Scientist Magazine.
- Bradley, P.S. and Ade, J.D. (2018). Are current physical match performance metrics in elite soccer fit for purpose or is the adoption of an integrated approach needed. International Journal of Sports Physiology and Performance. [Epub ahead of print].
Author Details
David McKenny
Research & Development Sport Scientist
Sport Science Dept.
[email protected]