13 May Live Data Application in Field Hockey
Introduction
Field hockey is an intermittent team sport played with a goalkeeper and 10 outfield players and depending on the level can be 60 or 70 minutes in duration [1].
Field hockey players are required to perform a number of high-speed efforts during match play [1,2,3,4].
A relatively unique factor within field hockey is the ability to make unlimited rotations with players on the bench [3].
With this in mind, it is important for coaches to understand the physical limits of their players. Lythe and Kilding [3] suggest that player rotations enable maintenance of physical performance and additionally limit tactical deterioration within a game.
In addition to limiting physical and tactical deficits, work conducted within Australian Football [5] states that managing playing time can assist in the reduction of soft tissue injury and subsequently recommend the number and duration of rotations.
The ability to view accurate real time movement and heart rate (when worn) data wirelessly on a laptop or iPad simplifies decision making on player status.
Due to the limits of staff permitted on the bench during major hockey tournaments, a wireless connection option enables the sport scientist to be anywhere in the arena and communicate data to the coach over radio headsets.
While there is data available in field hockey, none has previously looked at amateur level athletes. Thus, creating a normative data set is thoroughly important prior to using live data to inform decisions
Methods
Design
A combination of Apex Live iPad and Apex Live laptop applications were used during 17 field hockey games over a competitive season. Participants consisted of 16 amateur division 1 field hockey players 23 ± 6 years old, training twice and playing once a week. All games consisted of two 35-minute halves and time was not stopped for penalty corners.
Player rotations were performed using the benching function in either of the Live applications to highlight time on pitch, following recommendations made by White and MacFarland [1].
The live application being used was always available for the coach to view player’s physical data and interchanges were made by the coach as deemed required for tactical or physical reasons. Immediately following the match, data was freely available for the review of the players and coach.
Calculated metric data was then exported directly from either of the live applications in .CSV format.
Analysis
All data was stored in a Microsoft Excel worksheet on an individual player basis. Player position was indicated by the coach and players were grouped according to their primary playing position; Forwards (6), Midfielders (4) and Defenders (6).
Average and Standard Deviations were calculated for Total Distance, Distance per minute, High Speed Running (>5.5m/s) and High Speed Running per minute.
These metrics have all been previously been reported [1,2,3,4] and, whilst in different zones the application of terminology remains consistent. Smallest Worthwhile Change [6] was calculated to assist coach understanding of meaningful changes in physical performance metrics.
Results
Table 1 outlines that Midfielders spent the most time on the pitch, had the fewest rotations, completed the most distance and maintained their relative distance when compared to forwards and defenders.
This finding contradicts those previously reported [2, 4] where defenders in both cases spent the most time on the pitch. Midfielders in both studies completed the highest relative distance.
In line with McGuinness and colleagues, forwards completed the most High Speed Running meters and also performed more relative High Speed Running meters than both midfielders and defenders.
Defenders covered more distance and spent more time on the pitch than forwards but less than midfielders.
Consistent with McGuinness et al. Defenders also covered the least relative distance and High Speed Running distance.
Practical Applications
Apex Live applications provide the capacity to visualise real-time physical performance information.
This information enables a skilled operator to analyse performance and deliver insights to a coach in relation to player rotations in field hockey.
Through the creation of positional groups within Apex Live applications sport scientists and coaches can see which players are struggling to maintain their relative High Speed Running meters (figure 1).
Development of these normative values can also set critical benchmarks for the application of individual or group thresholds within the Apex Live system.
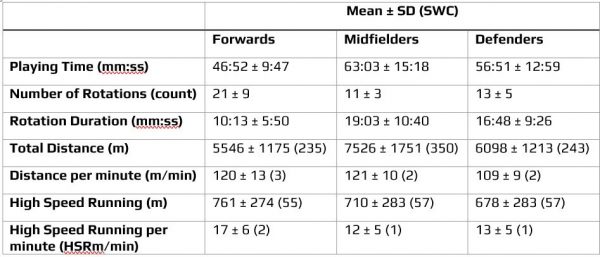
Table 1 – Normative data for amateur field hockey players.
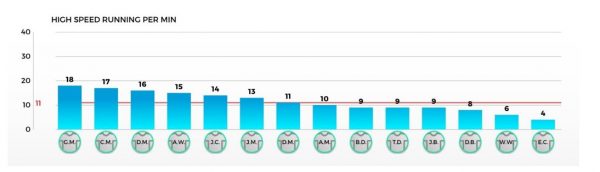
Figure 1 – Live data example from iPad application – HRS/min
The immediate nature of physical performance data can also inform sport science and medical staff on individual recovery strategies, especially within a condensed international hockey tournament format.
Outside of matches, live data use during training can have an incredibly positive influence. Setting objective training loads to be meet can further enhance performance.
When combined with accurate match volumes and intensities the sport science staff and coaches have a clear advantage in drill and training design.
Future developments of live data application could see continued improvement of on-board processing, including the calculation of more advanced metrics and further influence player activity periods.
References
- White, A. D., & MacFarlane, N. (2013). Time-on-pitch or full-game GPS analysis procedures for elite field hockey?International Journal of Sports Physiology and Performance, 8, (5), DOI: 10.1123/ijspp.8.5.549
- Mcguinness, A., Malone, S., Petrakos, G., & Collins, K. (2017). The physical and physiological demands of elite international female field hockey players during competitive match-play. Journal of Strength and Conditioning Research. 1. DOI: 10.1519/JSC.0000000000002158.
- Lythe, J. & Kilding, A. (2013). The effect of substitution frequency on the physical and technical outputs of strikers during field hockey match play. International Journal of Performance Analysis in Sport. 13. DOI: 10.1080/24748668.2013.11868693.
- Polglaze, T., Dawson, B., Buttfield, A., & Peeling, P. (2018). Metabolic power and energy expenditure in an international men’s hockey tournament.Journal of Sports Sciences, 36, (2), DOI: 10.1080/02640414.2017.1287933.
- Montgomery, P. G., & Wisbey, B. (2016). The effect of interchange rotation period and number on Australian football running performance.The Journal of Strength & Conditioning Research, 30, (7), doi: 10.1519/JSC.0000000000000597.
- Hopkins, W. (2004). How to Interpret Changes in an Athletic Performance Test. Sportscience 8, 1-7, [online], available: sportsci.org/jour/04/wghtests.htm.
Author Details
Sport Science Dept