
02 Jul Macrocycle Overview – Does Player Tracking aid Periodized Peak Performance?
Introduction
Peak performance in any sport requires maximal physical and psychological tolerance. For this to occur, an optimized training model must be developed for each athlete to continuously adapt and improve throughout a season, while also mitigating injury[1].
Defined as periodization, this approach breaks down a season into macrocycles, mesocycles, and microcycles (12-16 weeks, 4 weeks, and 7 days, respectively) [2]. All portions of a periodized training model are used in preseason, mid-season, post-season and off season to allow athletes to progressively overload and handle a wide array of metabolic and neuromuscular loads.
However, in the past, the ability to quantify load was hindered due to the variation of training load placed on team-based sport athletes. Missing crucial metrics due to this issue has presented increased difficulty quantifying seasonal demands that were placed on athletes. Because of this, residual fatigue and injuries often plagued periodized prescriptions [1].
Fortunately, due to technological advances in wearables and player tracking over the past ten years, practitioners have been able to use better insight to decrease the amount of significant maladaptation that has historically been associated with seasonal play.
In this insight, we will be looking into the STATSports Apex system, and seeing how it was utilised in a full season with a female collegiate soccer team to alter training and aid in decision making towards the best route to peak performance in a 4-month season.
Methods
STATSports microtechnology units were initially used on all athletes. The units comprised a 10-Hz Augmented multi-GNSS chip, a 952-Hz triaxial accelerometer, a 952 Hz gyroscope, and a 10 Hz magnetometer (STATSports Apex).
The unit was administered to each player before all training sessions and all games. Post event, all units were taken from players and downloaded into STATSports Apex Software, where a multitude of reports were completed daily, weekly, monthly and seasonally by the team.
Post-season, through a full database download, all data was sent to Sports Scientists at STATSports to complete in-house analysis. Three main cycles were investigated for this specific study; Cycle 1 consisted of 7-day reports, Cycle 2 consisted of 4-week reports and Cycle 3 consisted of a 16-week report.
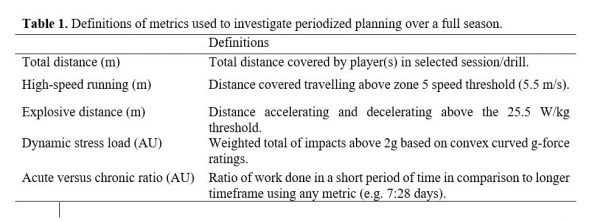
Each cycle specifically defined micro cycles, meso cycles, and macro cycles, respectively. To break these large data sets up five main metrics were specifically designed by STATSports were targeted. These metrics were Total Distance (TD), Explosive Distance (ED), High Speed Running (HSR), Dynamic Stress Load (DSL), and Acute v Chronic Ratio (A:C) (Table 1).
One player (Player 1) was chosen from a team of twenty-four collegiate female athletes, retrospectively of the season. The individual selected needed to be involved in every game and participated in at least three training sessions per week throughout the season.
Player 1 was then studied post-season to see if a periodized program was adhered to regarding the metrics selected. The below results reflect the trends these metrics track, that could not be quantified if not for the STATSports Apex system.
Results
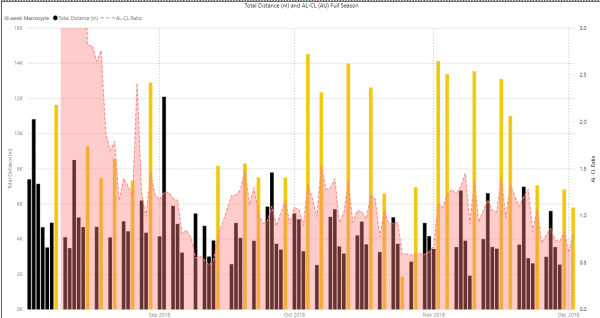
| Figure 1. Total distance (black = training sessioon; gold = game) and A:C ratio throughout a full season |
Specifically, when covering the topic of preparing players for peak performance, what is normally expected is a tapering plan that builds each player to reach their optimal performance at game time.
As can be seen in Figure 1, Player 1’s TD demonstrates what a typical periodized model would look like, where the training sessions (black) taper in preparation for the weekly/biweekly gameplay (gold). However, as important as tapering before a game, having higher midweek training loads allows Player 1 to maintain a higher level of physical fortitude.
This inverse relationship adheres well to the A:C (shown in red in Figure 1) profile to make sure a player is staying between a ratio of 0.8-1.5. From numerous literature it is proven that utilising this ratio can help understand what a players optimal training load looks like daily throughout a full season [3].
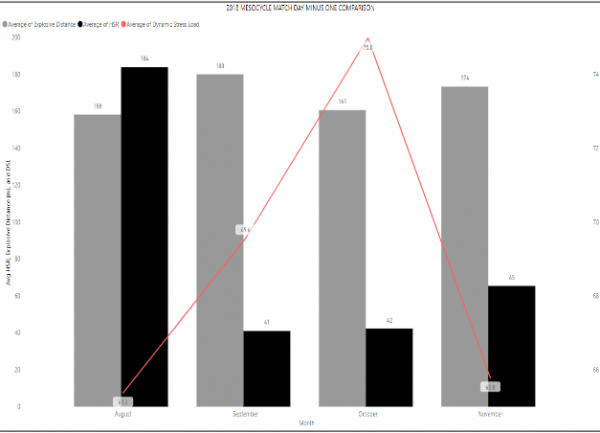
| Figure 2. Monthly MD-1 average explosive distance, high-speed running, and dynamic stress load in-season |
As Player 1’s data is compiled together, an understanding of how loads effect 4 week increments of performance is revealed. When looking over both Figure 2 and Figure 3, we notice specific trends in Player 1’s mesocycles.
In Figure 2, which highlights all match day minus one (MD-1) training sessions, average ED (rapid shorter bursts of accelerations and decelerations) never significantly decreases or increases throughout each month. However, average HSR decreased as Player 1 transitions from preseason to midseason play, but then sees a small increase as they move into post-season play.
Comparatively, when Player 1’s match day minus three (MD-3) training was observed there is an initial rise of both HSR and ED for the first two 4-week periods. Then Player 1 shows a decrease in both metrics in October.
However, as average HSR continues to drop into post-season, average ED shows a slight increase. Overall, the volume of ED and HSR seem to be higher on MD-3 when compared to MD-1. This proof is also strengthened by Figure 1.
This amalgamation establishes that Player 1’s training sessions midweek did not only have higher volume loads but also had higher intensities, and as game days approached both would see a total drop, tapering for optimal performance during a match.
TD, ED, and HSR are valued for understanding the external environment Player 1 was put in during the drills, sessions and games. However, internal loads experienced by the athlete help give a more accurate understanding to how the musculoskeletal system and central nervous system may be reacting to all external loads put on a player.
A portion of this internal load can be defined through DSL, as is shown in Figures 2 and 3. It is interesting to find that during MD-1 the internal load continuously increases leading all the way to post-season (November).
However, when looking at MD-3, this increase peaks during the second 4-week mesocycle and significantly drops after this period. This may have been a result of dramatically reducing time length of sessions to create a positive overloading adaptation for the higher volume and intensity Player 1 was exposed to on these days.
Discussion/Future Developments
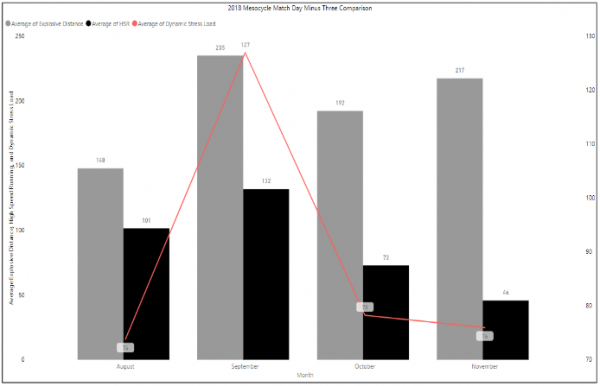
| Figure 3. Monthly MD-4 average explosive distance, high-speed running, and dynamic stress load |
The above analysis is one demonstration of the advantages of using the STATSports Apex system to breakdown player loading during a season. The ability to quantify internal and external loads has proved invaluable to understanding what Player 1 physically went through during a full season of competition.
It also gives a very clear insight into how training loads changed during different points of the season to optimize peak performance. The ability to deliver accurate data of on field performance shows how microtechnology helped this team maintain a high-level output for the full 4 months.
However, the above analysis is only a broad overview of what player tracking devices provide. While periodisation has been quite a useful tool in seasonal planning for team-based sports through subjective measures, the objective influence of microtechnology still has room to develop.
As research on periodisation using player wearables continues to advance, objective measures like the ones discussed above will provide more of an influence for preparation in seasonal demands, through pre-, mid-, and post-season.
References
- Gamble, Paul. “Periodization of Training for Team Sports Athletes.” Strength and Conditioning Journal, vol. 28, Oct. 2006, doi:10.1519/1533-4295(2006)28[56:POTFTS]2.0.CO;2.
- Wilmore, Jack H, et al. Physiology of Sport and Exercise. 4th ed., Human Kinetics, 2008.
- Gabbett, Tim J. “The Training-Injury Prevention Paradox: Should Athletes Be Training Smarter and Harder?” BJSM, doi:10.1136/bjsports-2015-095788.
Author Details
Nick Dykes
Sports Scientist