
22 Oct Maximum Intensity Periods: Accurate worst-case scenario drills in professional sports – A Case Study
Introduction
The use of physical performance indicators within professional sport is well documented.
Previous research has utilized fixed time periods to relay information pertaining to intensity and volume in professional sport [2].
The intermittent nature of professional sport means it is probable that the use of fixed drills [0-600s, 601-1200s, etc.) may underestimate true maximum intensity demands, and lead to increased injury risk in athletes not regularly exposed to match-intensity.
Russell et al, (2014) documented that match volume and intensity decreases in the second half compared to the first half; and within-halves, with significant decreases in acceleration-deceleration capacity reported in professional football [2].
Recently, literature published in relation to the use of rolling average time periods[1]
It is therefore also useful to quantify peak match demands during the longest ball-in-play durations to expose athletes to the appropriate volume and intensity to reduce the risk of underpreparing athletes for peak match intensities.
Methods
Participants
Participants were drawn from a representative underage Gaelic Football panel (n=36, 16±0.4y). Participant data were collected from GAA sanctioned matches (n=4) from February – May 2018.
Experimental Structure
Using STATSports Apex software (V3.0.04101), Maximum Intensity Period (MIP) drills were configured for average acceleration magnitude/minute (Acceleration Impulse).
This metric was chosen as acceleration capacity and intensity are known to deviate considerably throughout intermittent team sports [2].
The software calculates the peak metric time-period specified for each player in the session.
Values were then exported via standardized CSV export and data analysed in Microsoft Excel for mean peak values for MIPs & fixed time drills.
Results
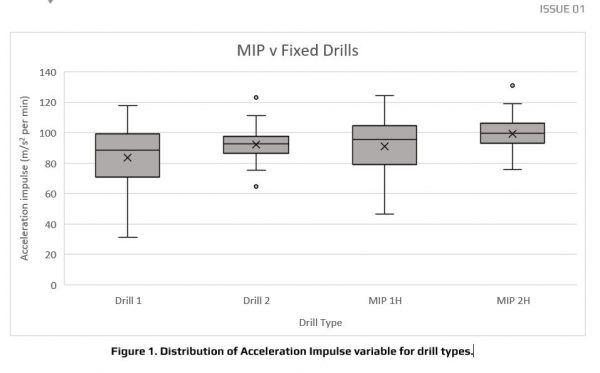
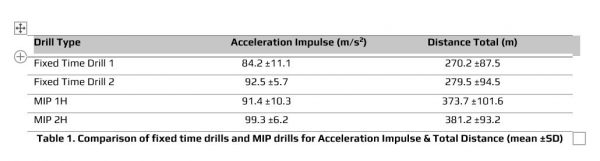
The results in Table 1 show that results for acceleration impulse were per minute & 92.5 ±5.7m/s2 per minute in the case of fixed time periods 1 & 2 respectively in comparison to MIP analysis which calculated the worst-case scenario as 91.4 ±10.3m/s2 per minute & 99.3 ±6.2m/s2 per minute for MIP 1 & 2 respectively.
Similar results were seen for Total Distance, with MIP 1 & 2 showing higher values than Fixed Drills.
Practical Considerations
This in-built tool can be utilized effectively to quantify true peak physical demands in a given sport.
When utilized effectively and in relation to ball in play scenarios it can be an effective drill planning tool, allowing practitioners create drills that accurately replicate match-intensity demands for the time frame of the drill.
Use of this could help to reduce injury risk by avoiding under-exposing athletes to match intensities.
References
- Cunningham DJ, Shearer DA, Carter N, Drawer S, Pollard B, Bennett M, et al. (2018) Assessing worst case scenarios in movement demands derived from global positioning systems during international rugby union matches: Rolling averages versus fixed length epochs. PLoS ONE 13(4): e0195197. https://doi.org/10.10.1371/journal.pone.0195197
- Russell M, Sparkes W, Northeast J, Cook CJ, Love TD, Bracken RM, Kilduff LP (2014) Changes in Acceleration and Deceleration Capacity Throughout Professional Soccer Match-Play. JSCR 30(10)/2839-2844.
Author Details