
06 Aug Monitoring an Athlete’s Internal Response: A Comprehensive Guide to Analysing Heart Rate Variability & Heart Rate Recovery
The Autonomic Nervous System (ANS)
To understand heart rate variability (HRV) and heart rate recovery (HRR), we need to first have an understanding of the Autonomic Nervous System (ANS); however, it is not the aim of this article to touch upon this in detail.
The ANS is responsible for regulating important systems in our body including respiration, perspiration, digestion and heartbeat.
The ANS consists of two branches; the parasympathetic (rest) and the sympathetic (activation) branch. Cardiac function is influenced by the ANS with the sympathetic system increasing heart rate and the parasympathetic system reducing it (1).
The goal of the ANS is to maintain a balance between these two subsystems. The vagus nerve plays a key role in the management of the ANS. This consists of two long cranial nerves that extend from the brain stem to various organs including the heart, lung and stomach.
Information is carried from the nervous system to the brain about what the body is doing governing a range of reflex responses.
The ANS is very sensitive to environmental conditions such as temperature, noise and light (6). Therefore, considerations should be made to standardise recording conditions so that the training-induced effects on ANS are isolated
HRR & HRV
Two metrics have made it possible to measure the ANS through heart rate (HR) monitoring; these are heart rate variability (HRV) and heart rate recovery (HRR).
HRR is the difference between the HR measured at the end of an effort and that of the recovery (2). The length of recovery can range from a few seconds to several minutes. HRV, on the other hand, is the variation between successive heartbeat intervals; commonly known as R-R intervals and is measured in milliseconds (ms).
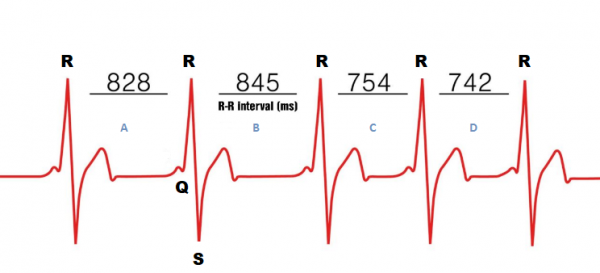
Figure 1 R-R Intervals in milliseconds
An electrocardiogram (ECG) consists of Q, R and S waves and this comes from the electrical activation of the heart ventricles forming the QRS complex. It characterises the parasympathetic and sympathetic influences of the ANS on the sinus node.
Heart rate, which is the number of beats per minute, is not an important reference here. Two individuals can have identical heart rates, yet their HRV may be significantly different (Figure 2).
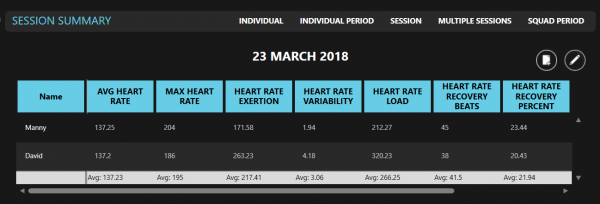
Figure 2 STATSports Apex session summary
Generally, a low HRV means there is less variation in heartbeats indicating that the body may be under stress while a higher HRV means that there is greater variability between successive heart beats indicating that the body is positively recovering from prior accumulated stress. During an active state lower HRV is favourable while at rest a higher HRV is favourable (1).
HRV & HRR in sport
In sport, both HRV and HRR have gained increased popularity in examining ANS functionality. HRV and HRR have been examined during rest, during exercise, following exercise and recovery following exercise.
The main interest in this form of monitoring is that it is cheap, relatively non-invasive, and can be applied simultaneously to many athletes.
Previously monitoring HRV & HRR was only possible with expensive electrocardiograms however the availability of valid heart rate monitors has increased the use of heart rate monitoring in the field.
The APEX system allows you to combine the most advanced athlete tracking device to various coded and Bluetooth heart rate monitors allowing you to calculate heart rate derived metrics in conjunction with external loading data.
Calculation
There are many different methods used to assess HRV and it is beyond the scope of this article to discuss these comprehensively.
The most commonly used are time domain analyses, frequency domain and nonlinear measures (5). The indexes each capture a different feature of the ANS, with some indices reflecting mainly cardiac parasympathetic activity, while others reflect the cardiac sympathetic activity (3).
For the purpose of this article, we will focus on the time domain methods as this method is commonly used in sport and it is also the way HRV is calculated within the APEX software.
The time domain method calculates the standard deviation (SD) of several RR interval time measurements. The resulting SD is combined into a mathematical equation giving a score that represents the functioning of the ANS.
The SD is the deviation of the time interval about the mean interval. There are a variety of SD metrics including SDNN, SDNN index, SDANN, pNN50 as described in table 1.
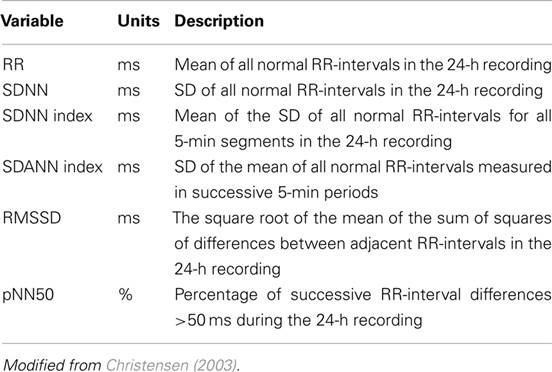
Table 1 SD metrics modified from Christensen (2003)
The APEX system calculates HRV using the square root of the mean of the sum of the squares of differences between adjacent normal R-R intervals (RMSSD). Simply put this assesses the successive differences between neighbouring RR intervals.
Figure 1 shows the RR intervals labelled A = RR1, label B = RR2, Label C = RR3, Label 4 = RR4 representing the intervals between neighbouring QRS peaks. The RMSSD is essentially looking for successive differences between the intervals for example:
Label A – Label B àRR1 (828ms) – RR2 (845ms)2
+
Label B – Label CàRR2 (845ms) – RR3 (754ms)2 and so on.
So based off the values in figure 1 we can calculate rMSSD as:
rMSSD = 28.11
To calculate both HRV and HRR you must cut a period/drill within the activity graph. Once the session is cropped you can right-click on the activity graph and select the function (Figure 3). This will calculate HRV and HRR only for the cropped period of time.
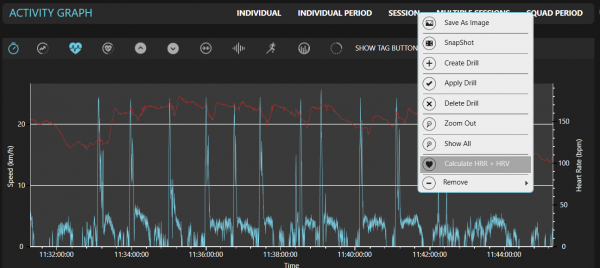
Figure 3 STATSports Apex activity graph
HRR is calculated by taking the max HR and subtracting this with the minimum HR found within the cropped period. HRR can be expressed in absolute terms i.e.
The number of beats that was recovered or as a percentage of the beats recovered from the start till the end.
For example, an athlete’s HR is 204BPM at the start of the recovery; after 3 mins of recovery, it is now 150BPM the HRR would be 54.
The software calculates HRV by looking at the difference in milliseconds between each heartbeat. The APEX unit can detect a heartbeat at 1000 ms accuracy (1 HZ) for accurate analysis. The R-R intervals can be exported with the function in the reports tab into excel. The R-R intervals are structured in excel as shown in figure 4.
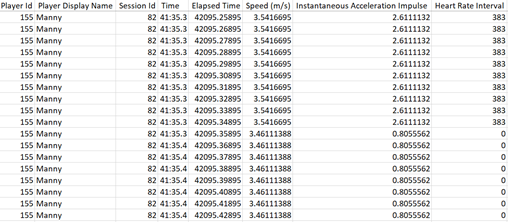
Figure 4 STATSports Apex entire session raw data export
The R-R intervals are nonsequential in the excel export due to the non-linear way the heart beats; its detection wouldn’t be in any order. This gives practitioners the ability to calculate rMSSD themselves.
Duration
Traditionally it took 10-minutes to obtain an accurate HRV measure (5-minutes of stabilisation followed by 5-minutes of recording), but with progressions in both research and technology, ultra-short recordings are now possible (4)
Ultra-short recordings of just 1-minute can provide reliable measures of HRV. The APEX system requires the cropped period/drill to be a minimum of 3 minutes in order to calculate HRV and HRR.
HRV Practical Applications
Best practice for athletes may be recording HRV during sleep or upon awakening in the morning for 5 to 10 minutes. HRV can be measured at rest either at night or in the morning, during exercise and post exercise.
Morning measures give time for the analysis to be measured before training meaning decisions can be made and training modified prior to the start of the session and then be modified accordingly.
In contrast, with exercise and post-exercise measures, which are generally performed during the session warm-up, there is no time for analysis before training.
As stated previously conditions should be made consistent in order to isolate the effects on HRV. Baseline measurements should also be established when monitoring HRV.
The start of the training week can be used as a baseline for example or a baseline measure can be made over several sessions. It is very important to have a baseline in order to detect performance changes and make valid comparisons.
HRV measures taken during exercise and post-exercise has been shown to not be of much use (9).
Research has also shown that single measures of HRV were not of much use when monitoring fatigue in triathletes’ players due to the day to day variation of the measure (10) however rolling averages were more sensitive (10).
On the other hand, it has been shown that HRV guided endurance training has led to performance improvements compared to traditional training protocols (8)
As stated previously an increase in HRV tends to be associated with a positive response to training while a decrease indicates a negative response (7).
However, the results in the literature vary and this may therefore not always be the case. Hence caution should be taken when interpreting this metric with context and a combination of other monitoring tools considered.
HRR Practical Applications
In the field, HRR & HRV is commonly carried out using an exercise performance test. This is to ensure that test conditions are as consistent as possible. Many practitioners use submaximal tests protocols as part of their warm-up allowing them to monitor HRR in athletes regularly.
These submaximal tests can be implemented for most athletes whether they are fit, fatigued or returning from injury all at different stages of the macrocycle without adding substantial fatigue.
There are currently no standard protocol recommendations available when it comes to measuring HRR however submaximal variations of established field tests such as the yo-yo test, multistage fitness test, 30-15 intermittent fitness test and fixed intensity runs have been suggested (14).
Research has suggested that a faster HRR is associated with the performance of athletes worsening (15)
Considerations
The within day to day variability of HR needs to be considered with your athletes, measured by the typical error and expressed as a coefficient of variation (12).
The variability in these metrics can be gathered from repeated longitudinal data collection of your own athletes (13) within the software. This can be done by selecting the data range for the player and viewing this in the squad type view in session squad period.
This would give you the average across your longitudinal data for your selected metrics. You can view this for the whole team or an individual player. You can apply these thresholds to the player by right-clicking on the table and selecting ![]() .
.
Researchers have proposed using the coefficient of variations (CV) and weekly averages of rMSSD as this may provide more meaningful interpretations than isolated HRV readings taken once per week as it is more sensitive to training load adjustments in the short term (7).
Also, to be taken into consideration is the minimum number of recordings to assess meaningful change in training statuses of athletes from HRV.
A minimum of 3 days per week has been shown to be appropriate when monitoring training adaptations in endurance runners (10).
However, understandably this is very difficult to implement in a team sports environment and may have been easier implementing with endurance athletes as they are much more receptive to the daily use of heart rate monitors (9).
Limitations
Of course, HR measures do not come without its limitations. Firstly, the sensitivity of HRV may depend on the body position of the athlete during the recording (11); being supine, standing or seating all influence HRV. HRV also depends on other factors such as stress, sleep and quality of life.
In addition to this, performance in team sports is not solely linked to the cardiovascular system; the neuromuscular, metabolic, psychological and skeletal all play a part in a performance.
HR measures should, therefore, be used in combination with other monitoring tools such as countermovement jumps and psychometric questionnaires to gain a complete picture of the status of the athlete.
Lastly, many practitioners use chest heart rate monitors which is susceptible to falling lose and can be uncomfortable for athletes.
However, the Apex unit has the capability of integrating with heart rate monitors which detect heart rate optically by measuring the wave of blood flow and can be worn on the wrist or detecting heart rate via Bluetooth heart rate monitors which attach to the back of our vests and stops the need for chest heart rate belts.
Conclusion
Monitoring heart rate may provide some insights into fatigue and training adaptation however practitioners should be aware of the limitations and recognise that a single measure cannot predict performance or fatigue but rather a range of measures taken holistically is recommended to add significant value to your monitoring strategies.
References
- Dong, J. G. (2016). The role of heart rate variability in sports physiology. Experimental and Therapeutic Medicine, 11(5), 1531–1536.
- Borresen, J., & Lambert, M. I. (2008) Autonomic control of heart rate during and after exercise: Measurements and implications for monitoring training status. Sports Medicine, 38(8), 633–646
- Malik, M. (1996) Heart Rate Variability: Standards of Measurement, Physiological Interpretation, and Clinical Use: Task Force of the European Society of Cardiology and the North American Society for Pacing and Electrophysiology. Annals of Noninvasive Electrocardiology, 1, 151-181.
- Munoz ML, van Roon A, Riese H. (2015) Validity of (Ultra-)Short Recordings for Heart Rate Variability Measurements. PLoS One,10(9)
- Billman GE. (2011) Heart rate variability—a historical perspective. Frontiers in Physiology,2,1–13
- Achten, J., and Jeukendrup, A. E. (2003). Heart rate monitoring: applications and limitations. Sports Med. 33, 517–538
- Plews DJ, Laursen PB, Stanley J. (2013) Training adaptation and heart rate variability in elite endurance athletes: opening the door to effective monitoring. Sports Med, 43,773–781.
- Kiviniemi AM, Hautala AJ, Kinnunen H, Tulppo MP. (2007) Endurance training guided individually by daily heart rate variability measurements. Eur J Appl Physiol, 101,743–751
- Buchheit M. (2014) Monitoring training status with HR measures: do all roads lead to Rome? Front Physiol,5:73
- Plews, D.J., Laursen, P.B., Kilding, A.E. (2012). Heart rate variability in elite triathletes, is variation in variability the key to effective training? A case comparison. Eur J Appl Physiol, 112, 3729
- Thomson, Rebecca L, Bellenger CR, Howe PR, Karavirta L, Buckley. (2016) Improved heart rate recovery despite reduced exercise performance following heavy training: A within-subject analysis. Journal of Science and Medicine in Sport, (19) 3, 255 – 259
- Hopkins, W. G. (2000). Measures of reliability in sports medicine and science. Sports Med. 30, 1–15.
- Hopkins, W. G. (2004). How to interpret changes in an athletic performance test. Sportscience, 8, 1–7
- Schneider C, Hanakam F, Wiewelhove T. (2018) Heart Rate Monitoring in Team Sports-A Conceptual Framework for Contextualizing Heart Rate Measures for Training and Recovery Prescription. Front Physiol, 9, 639.
- Botek, M., Krejčí, J., & Weisser, R. (2014). Autonomic cardiac regulation and morpho-physiological responses to eight-week training preparation in junior soccer players. Acta Gymnica, 44(3), 155–163
Author Details
Emmanuel Fajemilua,
Account Management,
Account Manager,