
11 May QUANTIFYING THE LOAD OF PITCH BASED PLYOMETRICS
SPEED & POWER DEVELOPMENT IN SPORT
High-speed actions are accountable for approximately 11% of the total distance covered in a soccer match, but it is the significance of these actions which highlight the advantages that developed speed attributes can elicit for performance gains.
High-speed running and sprinting have been identified as the two most common physical actions contributing to scoring situations [1, 2].
The significance of developing power for athletes cannot be understated due to its role in speed development.
Accelerations, decelerations, change of direction, and maximal velocity are all heavily reliant on the athlete’s capacity for power production.
Increasing athlete force and power capabilities will in turn lead to an increased stride length when running and a decreased ground contact time (amortisation phase) for each stride [3].
PLYOMETRICS FOR POWER DEVELOPMENT
Explosive sporting activities rely heavily on the athlete’s ability to produce a high rate of force through the utilisation of the stretch-shortening cycle (SSC) [4].
Plyometrics are commonly used in speed and power training as they are quick, powerful movements which incorporate the SSC and enhance power production capacity [5].
Plyometric exercises cause muscles to elicit a greater power output after the muscle has been stretched prior to contraction due to the elastic energy within the connective tissue, created during the stretch phase, contributing to power output upon contraction.
MOVEMENT TYPES & BENEFITS/FIBRE RECRUITMENT
Lower limb plyometrics may take the form of jumping, hopping and bounding training, and can range from low intensity bilateral hops to high intensity unilateral bounds.
Plyometrics benefits include:
- Increased type II muscle fibre recruitment so more muscle fibres contribute to power production.
- Increased rate of force development.
- Development of eccentric strength which improves the body’s ability to absorb force, reducing injury incidence [6].
By increasing the rate of force development, and in turn reducing ground contact time (GCT – the deceleration phase of actions due to friction), the speed of the athlete’s actions will improve.
NEED FOR STUDY
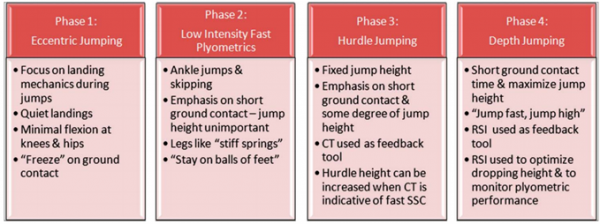
Plyometric programming typically follows a phased progression, from developing athlete capabilities beginning with eccentric landing jump exercises, moving to faster low intensity plyometric exercises, progressing to higher jump heights with reduced GCT, before finally aiming to maximise jump height whilst minimising GCT through depth jumps [5].
Load monitoring of plyometrics usually follows advised volumes of 80-140GCTs per session depending on ability level, with 1-3 sessions per week [7].
Double leg exercises will almost always have a higher force output than single leg exercises.
However, they are usually the lower intensity exercises as landing on 2 limbs will distribute the forces, compared to single limb exercises where impacts are absorbed unilaterally.
Through analysis of the accelerometer-based data from the Apex GPS unit, users can identify the external load being placed on the athletes.
From this, coaches can ensure that the plyometric loading of sessions for athlete’s is phased and progresses at an appropriate rate.
METHODS
Data was collected using 10HzGNSS device (Apex, STATSports), which includes a 100Hz accelerometer that recorded the metrics analysed in this study.
Data was obtained from 10 individuals over the course of 6 weeks, all of whom had 2+ years of resistance and plyometric training experience.
Each session included 3 plyometric exercises, with 2 sets of 10 reps completed for each exercise at the beginning of a field-based session, after a standardised warm up.
A recovery of 1 minute was allocated between each exercise, with an additional minute between sets.
Every set of each exercise was cut post download from the accelerometer graph using the drill cutting function in the Sonra desktop application.
The data pertaining to each set of each exercise was exported and analysed to obtain average values.
The metrics analysed were:
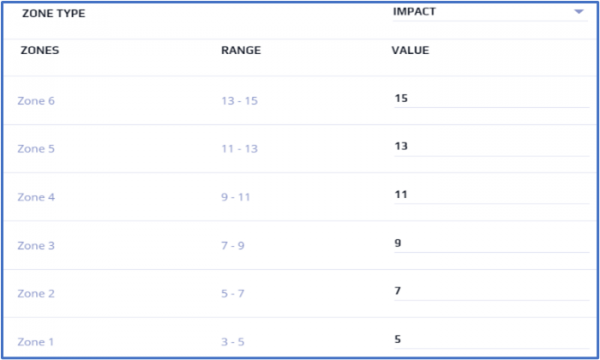
- Impacts – The magnitude sum of the data from the tri-axial accelerometer over a 1 second period.
*Default Zone values from Sonra 3.0 were used for each Impact Zone, shown in Figure 1.
- Dynamic Stress Load (DSL) – A weighted total of impacts above 2G, based on a convex curve of G-force ratings.
- Total Loading – A total of the forces on the player without weightings being applied.
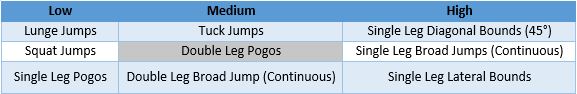
A range of exercises were completed including those deemed to be of a ‘lower intensity’ due to the exercise being bilateral with increased GCTs, to ‘higher intensity’ unilateral exercises with reduced GCTs. Maximal height or distance was encouraged throughout.
A range of exercises were completed including those deemed to be of a ‘lower intensity’ due to the exercise being bilateral with increased GCTs, to ‘higher intensity’ unilateral exercises with reduced GCTs. Maximal height or distance was encouraged throughout.
RESULTS
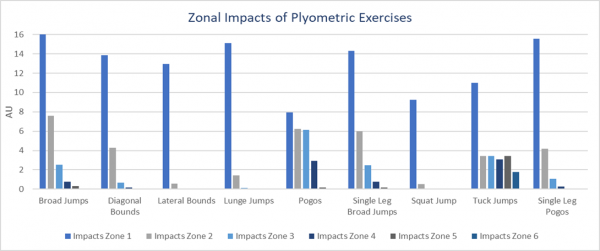
Figure 2 – Zonal Impacts of Plyometric Exercises
All exercises had relatively similar impacts in zone 1. Diagonal bounds, lateral bounds, lunge jumps and squat jumps experienced high levels of impacts in zone 1 relative to other zones.
Broad jumps, single leg broad jumps and single leg pogos all demonstrated similar trends with impacts gradually decreasing from zone 1 to zone 6. Double leg pogos and tuck jumps possessed the largest number of higher-level impacts with impacts from zone 2 to 5 ranging from 3 to 6 per set, with tuck jumps containing the highest number of zone 6 impacts.
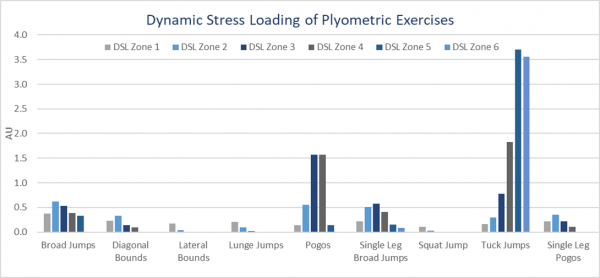
Figure 3 – Dynamic Stress Load of Various Plyometric Exercises
Dynamic stress load follows a similar trend to zonal impacts, with low values across diagonal bounds, lateral bounds, lunge jumps and squat jumps, and broad jumps, single leg broad jumps and single leg pogos having a slightly higher level of DSL, averaging approximately 0.5 AU.
Double leg pogos and tuck jumps are again the exercises with the highest values, with tuck jumps having extremely high values in comparison to the other exercises with a zone 5 and zone 6 values above 3.5 AU.
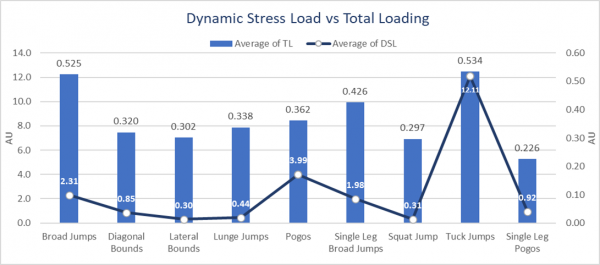
Figure 4 – Dynamic Stress Load vs Total Loading
PRACTICAL APPLICATION
Monitoring plyometric loading is multifactorial and cannot be solely categorised by one metric. Therefore, a wide range of factors should be considered in the planning, implementation, and monitoring of the exercises [8].
The monitoring of the accelerometer-based data from the Apex device allows users to quantify the external load placed on the athlete.
Coaches who frequently use Dynamic Stress Load or Total Loading as load monitoring metrics can identify the loading demands that plyometric exercises will place on the athletes.
Through quantifying plyometric loading and correlating these values with subjective athlete monitoring, individual athlete responses to plyometrics can be recorded and used as a potential predictor of fatigue to optimise athlete preparation.
Potential relationships between fatigue and metrics such as Dynamic Stress Load can be identified through intra-session DSL comparison as peak impact values of foot strikes/GCT’s will increase as a player fatigues.
By monitoring the external loading of pitch based plyometrics over a period and comparing this data with subjective athlete feedback on fatigue, coaches will be able to identify the stimulus they wish to apply to their athletes.
Individual athlete technical competence and goals can also be used to determine plyometric exercise selection, with athletes developing competency in low intensity plyometrics, before progressing to higher intensity plyometrics.
CONSIDERATIONS
It is important to note that not all athletes will respond to plyometric exercises, or any training stimulus for that matter, in the exact same way and so subjective monitoring of athletes is essential.
Identifying individual response to the plyometric loading is important to ensure that the stimulus is not causing excess fatigue and negatively affecting performance.
Additionally, it should be noted that as plyometric exercises are a mode of power development, central nervous system (CNS) fatigue will be incurred which requires a longer recovery period than the more frequently experienced muscular fatigue.
Varying the surface which plyometrics are completed on has been identified as an effective way to elicit additional speed and power production capacities of athletes.
A structured 8-week program incorporating field based plyometrics, alongside the more commonly completed gym based plyometric exercises elicited considerable performance gains when completed alongside a solely gym based plyometric programme [11].
A phased plyometric program such as the 4-step implementation tool (Fig. 5) should be incorporated alongside a periodised strength and conditioning program to ensure that athletes develop other vital components of fitness.
Specifically, lower limb strength development will aid in the athlete’s force production capacity, and lead to an increase in the potential forces that can be generated with each ground contact.
AUTHOR
Aaron Beattie,
STATSports Sports Scientist-Account Manager.
REFERENCES
- Little, T. and Williams, A. (2003) Specificity of acceleration, maximum speed and agility in professional soccer players. London: Routledge.
- Schimpchen, J., Skorski, S., Nopp, S. and Meyer, T. (2016) Are “classical” tests of repeatedsprint ability in football externally valid? A new approach to determine in-game sprinting behaviour in elite football players. Journal of Sports Sciences, 34(6), pp. 519-526.
- Lockie, R.G., Murphy, A.J., Schultz, A.B., Knight, T.J. and de Jonge, X.A.J. (2012) The effects of different speed training protocols on sprint acceleration kinematics and muscle strength and power in field sport athletes. The Journal of Strength & Conditioning Research, 26(6), pp. 1539-1550.
- Esformes, J.I., Cameron, N. and Bampouras, T.M. (2010) Postactivation potentiation following different modes of exercise. The Journal of Strength & Conditioning Research, 24(7), pp.1911-1916.
- Flanagan, E.P. and Comyns, T.M., 2008. The use of contact time and the reactive strength index to optimize fast stretch-shortening cycle training. Strength & Conditioning Journal, 30(5), pp.32-38.
- Beato, M., Maroto-Izquierdo, S., Turner, A.N. and Bishop, C., 2021. Implementing strength training strategies for injury prevention in soccer: scientific rationale and methodological recommendations. International journal of sports physiology and performance, 16(3), pp.456-461.
- Davies, G., Riemann, B.L. and Manske, R., 2015. Current concepts of plyometric exercise. International journal of sports physical therapy, 10(6), p.760.
- Brearley, S., Wild, J., Agar-Newman, D. and Cizmic, H., 2017. How to monitor net plyometric training stress: Guidelines for the coach. Strength Cond, 47, pp.15-24.
- Turner, A.N. and Jeffreys, I., 2010. The stretch-shortening cycle: Proposed mechanisms and methods for enhancement. Strength & Conditioning Journal, 32(4), pp.87-99.
- Potach DH, Chu DA. Plyometric training. In: Earle RW, ed. Essentials of Strength and Conditioning. Champaign, IL: Human Kinetics; 2000:427-470.
- Ramirez-Campillo, R., Álvarez, C., García-Pinillos, F., García-Ramos, A., Loturco, I., Chaabene, H. and Granacher, U., 2020. Effects of combined surfaces vs. single-surface plyometric training on soccer players’ physical fitness. The Journal of Strength & Conditioning Research, 34(9), pp.2644-2653.