02 Mar Super League sign league-wide deal with STATSports
Our Expert Sports Scientist Niall Cafferkey talks about his experiences training up RFL coaches on STATSports Viper system. All 12 RFL teams will be monitored by STATSports for the 2015-2018 seasons.
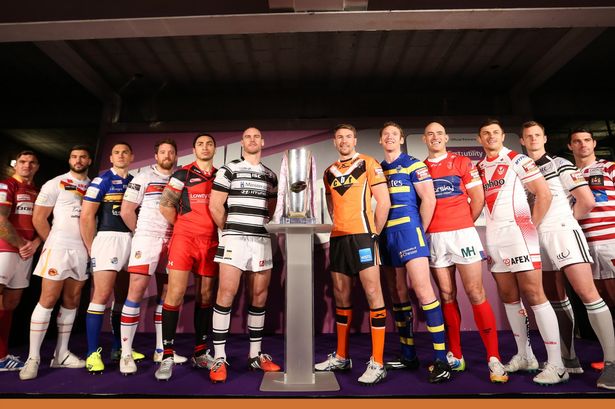
STATSPORTS are proud to announce that we have teamed up with the Rugby Football League for the 2015/2016 season. STATSPORTS will provide full GPS equipment and support to all 12 teams competing in this season’s super league. It is exciting times for the super league; the data will permit normalised sports science research across the board. Therefore, even more detailed analysis can be completed on the physiological demands of rugby league and the correlations between a successful and unsuccessful performance.
STATSPORTS broadcast on the Horizon
STATSPORTS will soon provide important post match data to the viewing public on metrics such as collisions, total distance and high speed running. This will give the viewer the opportunity to gain some sports science knowledge about rugby league. Fans will be able to view each team’s data and see the work outputs of the individual players during a game.
Recently, I travelled to the greater Yorkshire area of England to train each team’s fitness staff on how best to incorporate the Viper system into their games and preparation. The trip itself was very enjoyable. I met a range of coaches with different coaching backgrounds and different outlooks on how to implement the innovative STATSports concept with their clubs.
It was an extremely interesting experience exchanging ideas and information with such a knowledgeable group of coaches. With the enthusiasm each of the fitness teams showed to embrace STATSports, there is no doubt that the Viper system will be essential tool to the Super league into the future.
Benefits of using STATSPORTS in the super league.
- Permits weekly and daily load management
- Monitors each individuals responses to training
- Allows player comparison during training
- Used as a tool to prevent injuries
- Monitors work rates during each drill
- Ability to set different thresholds for different training days
- Immediate feedback given via Viper live streaming
- Analyse and quantify collisions and impacts during games
- Analyse internal physiological responses to training.
A sample of Rugby League analysis
Max intensity period (MIP)
The MIP of an individual pin points a three minute period where they are at their highest intensity during a game or training session. Naturally, each player’s MIP will be at different times, depending on their position and their impact on the game. The two metrics that determine the MIP are high metabolic load distance (HMLD) and collision load.
HMLD represents High Speed Running as well as each players distance covered through accelerating and decelerating,while the collision load provides information about the intensity and duration of each collision. Both metrics provide a clear indication of the workload and intensities reached during game time.
The MIP gives an ideal indication of the physical demands of rugby league during its highest intensity period and will allow any metric to be viewed during this particular time. Of course, the time period of the MIP is totally configurable depending on the sport and length of the game.
Practical applications of MIP
The MIP enables the fitness staff to implement more specific preparation during training in order to meet physical demands during matches. The information from the data gives the coaches the option to mirror game demands or even over stress the players, depending on the coaching philosophy.
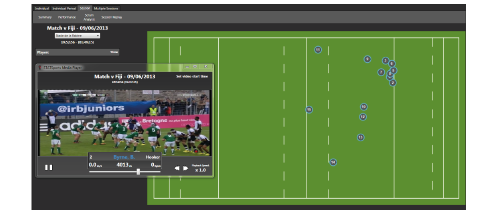
Coaches can, retrospectively, view their MIP data against their stronger oppositions and target what game demands that they need to meet. More importantly, the video and sports code import option allows the user to attach and synchronise the video with a player’s activity graph. With this in mind, the coach can view and review the exact actions and movements of each player during a session.
This, in the future, may lead to a shift from traditional shuttle running to an increased amount of small sided games and individualised conditioning sessions. For example, a specific drill that includes actions during the game such as taking hits, tackling, passing and shuffling backwards and forwards may test an individual’s lactate tolerance to the limit rather than just intermittent running on its own.
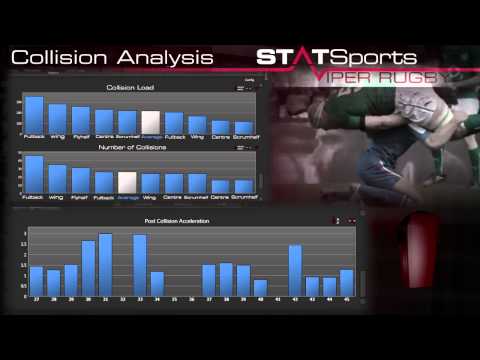
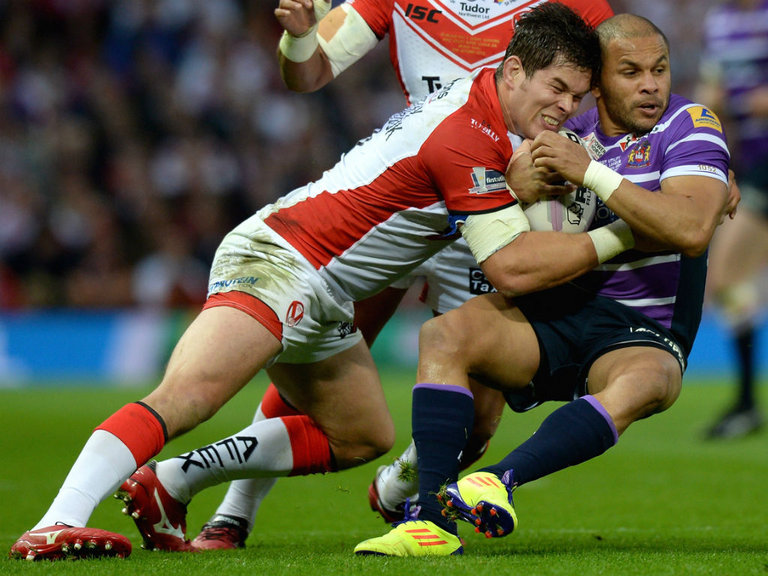
Individual Collision Impact Analysis
Viper rugby allows the tracking and analysis of individual collisions and impacts during training and game situations. The viper pod with its built in 100 HZ accelerometer can detect the real force of each collision and perceive different contact situations and the load it has on each player. The software gives a breakdown of each collision including the start time, end time, duration and collision load for each tackle.
An accumulative load can also be calculated after a game or training session to look at the total load and physical damage put on each player. During collision monitoring the coach can also view the player’s time to feet and post acceleration after each collision. Impact analysis also allows the user to view the instantaneous force directed on a player and is measured in 6 zones. Zone one which includes minimal forces of 3-5g while Zone 6 looks at the higher forces such as a tackle of 13-15g, impacts that exceed these values can be simply viewed on each individual’s activity graph.
Practical applications of collision analysis
The collision load and the measure of total impacts can be used as a tool to monitor the fatigue and the actual damaging effect a hit has on a player. It has been suggested that throughout the season position specific demands such as High speed running and metres per minute, can be quite similar from game to game.
However, the collision load may vary depending on the opposition and the physical nature of the game. This allows the fitness team to plan and periodize in more detail the physiological and external responses to training and games. The data from the collision load and impact analysis permits the fitness staff to individualise recovery methods. An analysis of collision load paired with HMLD gives a more clear indication of each player’s workload.
This data can then be used to prioritise recovery methods and to identify who needs more recovery than others. This will be a vital aspect for super league teams who, more often than not, have a quick turnaround of games.
In addition, the time to feet option has the potential to influence the tactical analysis of a rugby league team. The coaches can view how quickly the player takes to get up off the ground after the tackle. In rugby league this is crucial, as the time to feet influences the play of the ball and therefore the speed of attack. The post acceleration after a collision quantifies this speed of attack. Naturally, every super league team will want to be on their feet as fast as possible and have a high acceleration afterwards, in order to increase their chances of putting their opposition on the back foot and scoring more tries as a result.
Niall Cafferkey, Sports Scientist.
Follow us on Twitter, Facebook & Linkedin
To make an Enquiry, contact us: [email protected]