29 Jul Scrum Analysis- Utilisation and Application in SONRA
Introduction
The scrum has a large role to play in rugby, on average there is around 19 scrum events during an international rugby match [1] which is around one every four minutes.
As a performance indicator, scrum success can heavily impact the outcome of the game.
The more scrums a team loses the more likely they are to lose the game: winning teams have a 90% success rate in this action on their own put into the scrum. [2] In the 2011 RWC the top 8 finishing teams scored on average 1.8 tries per game from set piece scenarios including scrums. [3]
The scrum in rugby has also been highly associated with having a perceived risk of spinal injuries [4].
Exposing players to high chronic workloads and using the Training Injury Preventions Paradox model states that players with a higher training load will have fewer injuries when completing similar intensities during game scenarios.
Therefore, it is in the best interest of practitioners to expose their players to match intensity workloads in all areas of the game, including the scrum. This, in turn, will reduce the risk of catastrophic injuries during performance.[5]
Coaches will put a large emphasis on training and improving the scrummaging abilities of their forwards to compete at the top level.
They will also want to expose their players to match intensity scrum loads in order to reduce injury risk.
However, there are few accessible and affordable ways to measure and compare scrums in a game and in training.
With the SONRA software’s Scrum Analysis tool, coaches can monitor scrum load and performance in games and training utilising GPS technology.
Implementing Scrum Analysis in SONRA
In order to run Scrum Analysis in Sonra, players must be sorted into relevant scrum groups. This will be in reference to the position they play in the scrum (Front Row, Second Row or Back Row).
If any players within the session are not put into the relevant scrum group, then they will not be included in the Scrum Analysis.
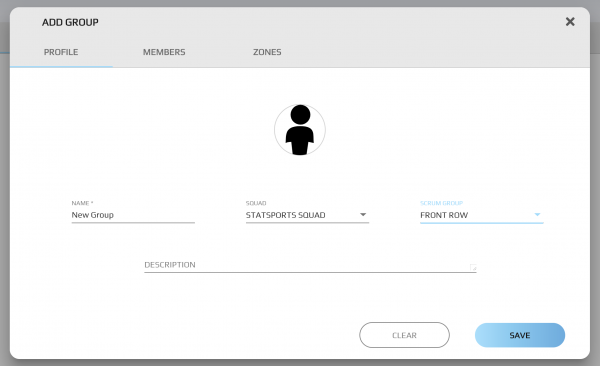
Figure 1 – Creating Scrum Groups
Once players have been assigned to the correct groups, scrum analysis can be run on the session. In order for a scrum to be detected a minimum of 6 players must have taken part.
After running the analysis, each individual scrum will be available to view and a metric table will show averages for each of the scrum metrics (Figure 2), it will also give data for each player involved with metrics including: scrum duration, hit sync, total impact, time to feet and post scrum acceleration.
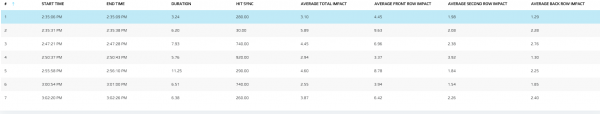
Figure 2 – Individual Scrum Averages
Within SONRA, these values can be exported in several ways. Using the Metrics tab all scrums can be exported as a .csv file for use in third-party platforms. Scrums can also be exported as an XML which can be imported to external video analysis platforms such as Hudl Sportscode.
Each metric in Figure 3 can be visualised individually comparing each player involved within the Scrums dashboard in SONRA.
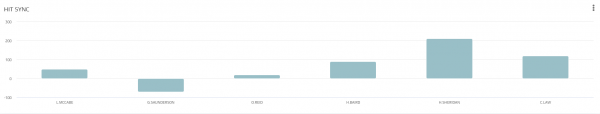
Hit Sync: The synchronisation of engagement from each player measured in milliseconds (ms). A positive (+) value represents early engagement, meanwhile a negative (-) value represents late engagement.
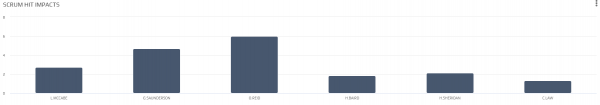
Figure 5 – Comparison of Scrum Hit Impacts per player
Scrum Impacts: The peak force of the impact during engagement in G’s.
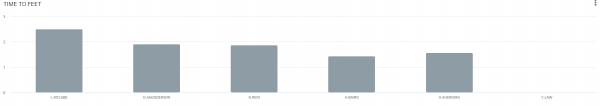
Figure 6 – Comparison of Time to Feet per player
Time to Feet: The time (ms) it takes for a player to return to their upright positions after a scrum.
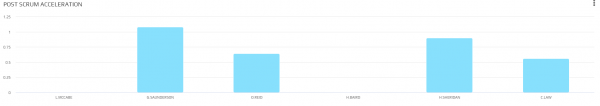
Figure 7 – Comparison of Post Scrum Acceleration
Post Scrum Acceleration: The acceleration a player moves away from the scrum (m/s/s).
The Scrum Load metric is used to summarise each individual scrum as a total value and simplify the analysis. This metric gives an arbitrary figure and takes into account the scrum duration, peak impact magnitude and player hit sync.
Application of Scrum Analysis
Once a sufficient volume of data has been accumulated, users can begin to compare similar sessions or games to each other in order to set target loads in different types of sessions. This can be done through the squad/individual period option.
Following post session analysis, by comparing historical data and analysing session plans, practitioners can profile specific drills and sessions and gauge the loads put on players during these sessions.
In turn, they can effectively plan and implement relative session intensities aligned with their desired session load. In doing this, practitioners can ensure players are exposed to the correct load throughout the week on specific session types (MD-1, MD +1, MD etc.).
With a more effective training plan this will create more robust athletes capable of coping with and exceeding the target loads.
By setting thresholds within the software for the number of scrums and the associated scrum load, practitioners can control the load on any given training day.
This is a useful tool to easily visualise if target levels of scrums and scrum load have been achieved or if the players have been overloaded or under exposed.
Scrum performance can be analysed using the hit sync data collected. The success of a scrum depends on the force production at an individual level but also the combined effort and co-ordination at a team level.
[6] Therefore the more in sync the players engage at the scrum the more likely they are in being successful.[7]
Practical Considerations
More research is required using Sonra’s Scrum Analysis feature in order to obtain normative data, although other research has provided examples of methods to acquire thresholds for players.
The use of rolling averages on 1- and 2-week periods will influence injury risk. Increasing 1-week and 2-week loads to previous averages can increase the risk of injury therefore keeping track of rolling averages will allow practitioners to ensure they do not over-train and exceed these thresholds. [8]
Scrum load is a metric that is not available when running a live session. This is due to the complex algorithms required for analysis which can only be calculated post session.
Although, as previously mentioned, with the use of a database where there is expected and repeatable values for set activities, practitioners can still manage player load during the session.
Hit Sync is not the only factor that is linked to scrum performance. Other factors must be considered such as optimising joint angles and individual force production [6].
Although the Scrum Analysis tool is useful for certain aspects of scrummaging it would be beneficial to use this in conjunction with video analysis too.
References
- Mark Sayers (2009) Kinematic analysis of high-performance rugby props during scrum training. Science and Football VI: The Proceedings of the Sixth World Congress on Science and Football [Online]. Available at: https://books.google.co.uk/books?hl=en&lr=&id=wfv0_PiqGGcC&oi=fnd&pg=PA57&dq=scrum+performance+rugby&ots=INmGUbEGP5&sig=0aW2_5ax6kPLLSgiGvKPkmrkpYY&redir_esc=y#v=onepage&q=scrum%20performance%20rugby&f=false (Accessed: 25/02/2020).
- Ortega, E., Villarejo, D. and Palao, J. (2009). Differences in Game Statistics Between Winning and Losing Rugby Teams in the Six Nations Tournament. J Sports Sci Med 8, 523-52
- Hughes, M., Hughes, M., Williams, J., James, N., Vuckovic, G. and Locke, D. (2012). Performance indicators in rugby union. Journal of Human Sport and Exercise, 7(2), pp.383-401.
- Trewartha, G., Preatoni, E., England, M. and Stokes, K., 2014. Injury and biomechanical perspectives on the rugby scrum: a review of the literature. British Journal of Sports Medicine, 49(7), pp.425-433..
- Gabbett, T. (2017). Infographic: The training–injury prevention paradox: should athletes be training smarter and harder?. British Journal of Sports Medicine, 52(3), pp.203-203.
- Green, A., Coopoo, Y., Tee, J. and McKinon, W., (2019). A review of the biomechanical determinants of rugby scrummaging performance. South African Journal of Sports Medicine, 31(1), pp.1-8.
- Green A, Dafkin C, Kerr S, et al. Combined individual scrummaging kinetics and muscular power predict competitive team scrum success. Euro J Sport Sci 2017; 17(8): 994-1003. [http://dx.doi.org/10.1080/17461391.2017.1343387]
- Rogalski, B., Dawson, B., Heasman, J. and Gabbett, T., 2013. Training and game loads and injury risk in elite Australian footballers. Journal of Science and Medicine in Sport, 16(6), pp.499-503.
Author Details
David McMaster
Account Management
Account Manager – Sport Scientist