
14 Apr Sonra Desktop Updates
The latest update to Sonra provides end users with more customisation to design and set up their software to their preference.
The aim of these updates is to give back time to users, where dashboards are easily customisable so that, post download, users can export a PDF with the push of a button providing insightful reports for coaches and other stakeholders.
Along with the enhancements made to reporting, Sonra now introduces more context within reporting and mapping features to make the translation of data more simplistic and relative.
Lastly, Sonra’s API has been improved to offer more data from Sonra to 3rd parties and/ or internal AMS’s.
Positional Groups
Sonra now introduces a new structure to player positions, where users can create primary and secondary positions.
Primary can act as the positional group, whereas the secondary can act as the position within the group (i.e., Primary: Defender, Secondary: Central Defender).
This positional structure allows to add more context to reporting and to directly compare data of players in same positional groups rather than uniformly comparing the entire squad.
Sonra allows users to now group metric charts and tables within primary positions to produce clear comparisons within charts & reports.
Primary and Secondary positions have also been added as new fields for csv export and via API.
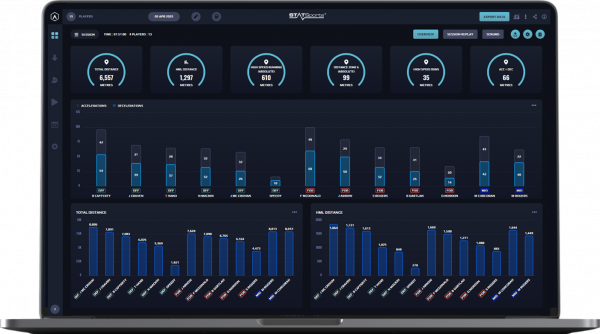
Figure 1. Sonra’s new Positional Chart groupings.
Positional Groups have a similar structure to Drill Labels (although no tertiary label) and can also be set up in settings page in Sonra.
To create the positions, users must first create the primary position and then add the secondary positions within the selected primary (positional group).
Positions are assigned to players via their profile with two new fields for primary and secondary now added.
Customisable Dashboards & Reports
Sonra dashboards have now become more customisable than ever before, with the ability for users to design the layout of each of the dashboard pages through positioning of widgets, enable or disable widgets, create up to 24 combo metric charts with bar, line, and area charts (scatter, bar & pie charts available for single metric charts).
Combo charts can also be formatted as stacked, 100% stacked or non-stacked allowing users to translate their data in a much more digestible way for coaches and stakeholders
Metric Charts have also been updated to better display data, making it easier for users to identify any differences in the data while also improving the legibility of data labels.
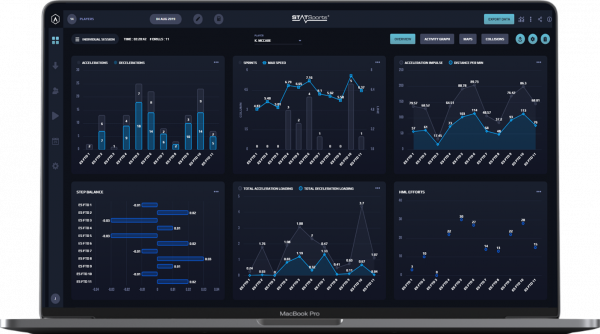
Figure 2. Sonra’s new dashboard improvements.
As a means to translate metric data with more context, Sonra now provide users with the ability to report data as a percentage of the selected threshold profile.
This can be an easy way to present information in a more understandable format for coaches without overwhelming them with excessive values, but instead a percentage value of a set target, session norm or relative to game data.
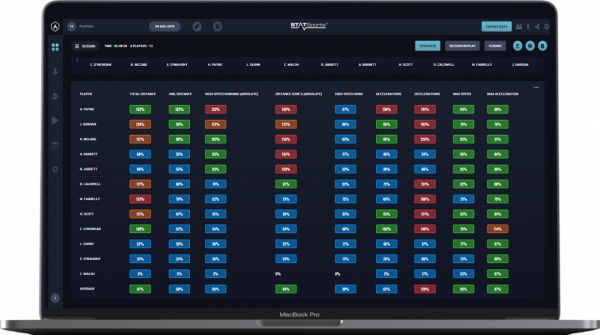
Figure 3. Sonra’s dashboard with metric % enabled.
Instant PDF Reports
Sonra allows for users to customise their 5 dashboards uniquely (Individual Session, Session, Squad Period, Individual Period & Multiple Session) meaning that they have 5 pre-set reports that can pushed directly to PDF in minutes post session using the export to PDF function.
Sonra’s dashboard to PDF function allows users to print a PDF of the current selection on the dashboard immediately, including threshold colours and percentages, positions, and custom sorting, while also allowing them to disable any of the widgets that are displayed on the dashboard.
Dashboard PDFs have been revamped based on practioner’s feedback with the inclusion of the averages on every chart, increased number of columns and rows in the metric table, increased legibility, and prominent data labels.
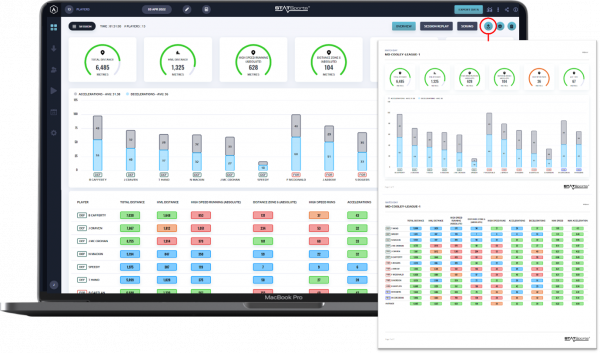
Figure 4. Sonra’s Dashboard to PDF function.
Contextualised Sprint Maps
To better understand sprint performance, Sonra’s sprint maps now allow multiselecting of drills (up to 10) to display what period the sprint occurred in, which helps further contextualised direction, angle and length of sprints.
Each drill is assigned a unique colour and if the sprint occurs in that drill the sprint arrow will be displayed in the respective colour.
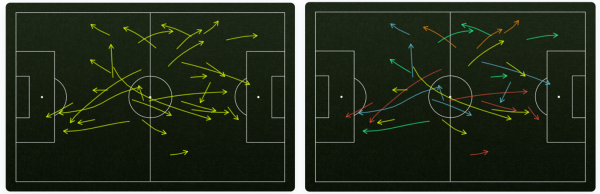
Figure 5. Sonra’s old sprint maps and new with drill context.
Sprint maps also provide a legend beneath the map with the selected drills and colour they each represent.
The multiselect drill function is also available on all other map types (heatmaps, time spent & positional).
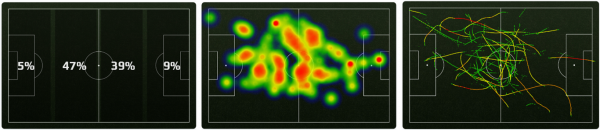
Figure 6. Sonra’s Time Spent, Heatmap, and Positional map functions using drill multi-select.
API Updates
Sonra’s API has been improved and become more extensive for end users.
Sonra now has the ability to send the full Raw Data via API, including 10hz GNSS data and 100Hz Accelerometer & Gyroscope data.
In addition, Sonra’s API now also provides all metrics from the software including user created metrics from the Custom Metric Calculator. Drill Label components in Primary, Secondary, Tertiary and Free Text fields are also now available in the API.
To improve user experience, a new date range endpoint has been added to make it easier for users to query sessions within a selected date range along with improvements made to file storage limit.
For more information on these updates, please contact your Account Manager or get in touch.