07 Mar Sonra Metric Event Exports – Applications and Visualisations
INTRODUCTION
The quantification of sport-specific actions during training sessions and competitions is known to be a key aspect of the athlete load monitoring process.
These actions are repeated high-intensity short bouts and sprinting efforts, separated by short periods of lower-intensity walking and jogging [1].
This high-intensity, intermittent nature of physical demands can be found in most team sports, including football, rugby, Australian rules football, hockey, Gaelic football, hurling, and many others.
It is of interest for sports scientists to quantify the athlete’s exposure to these types of physical activities, since the volume, intensity and frequency of training has been found to have a positive impact on performance.
It has also been reported that negative adaptations to training can occur when the training load is excessive, and recovery is inadequate [2].
Therefore, to maximize team performance and maintain a lower risk of injury, it is crucial to monitor our athlete’s production of high levels of muscular force through repeated sprinting, rapid accelerations and decelerations, and changes of direction.
When using GPS/ GNSS (Global Navigation Satellite System) data, some of the most relevant metrics that reflect the external load of athletes are those related to distance covered at high speeds, accelerations and decelerations, and the efforts involving high metabolic power [3].
In the Sonra application, these metrics are known as High Speed Running, Sprints, HML Efforts, High Intensity Bursts, Accelerations, Decelerations and Impacts.
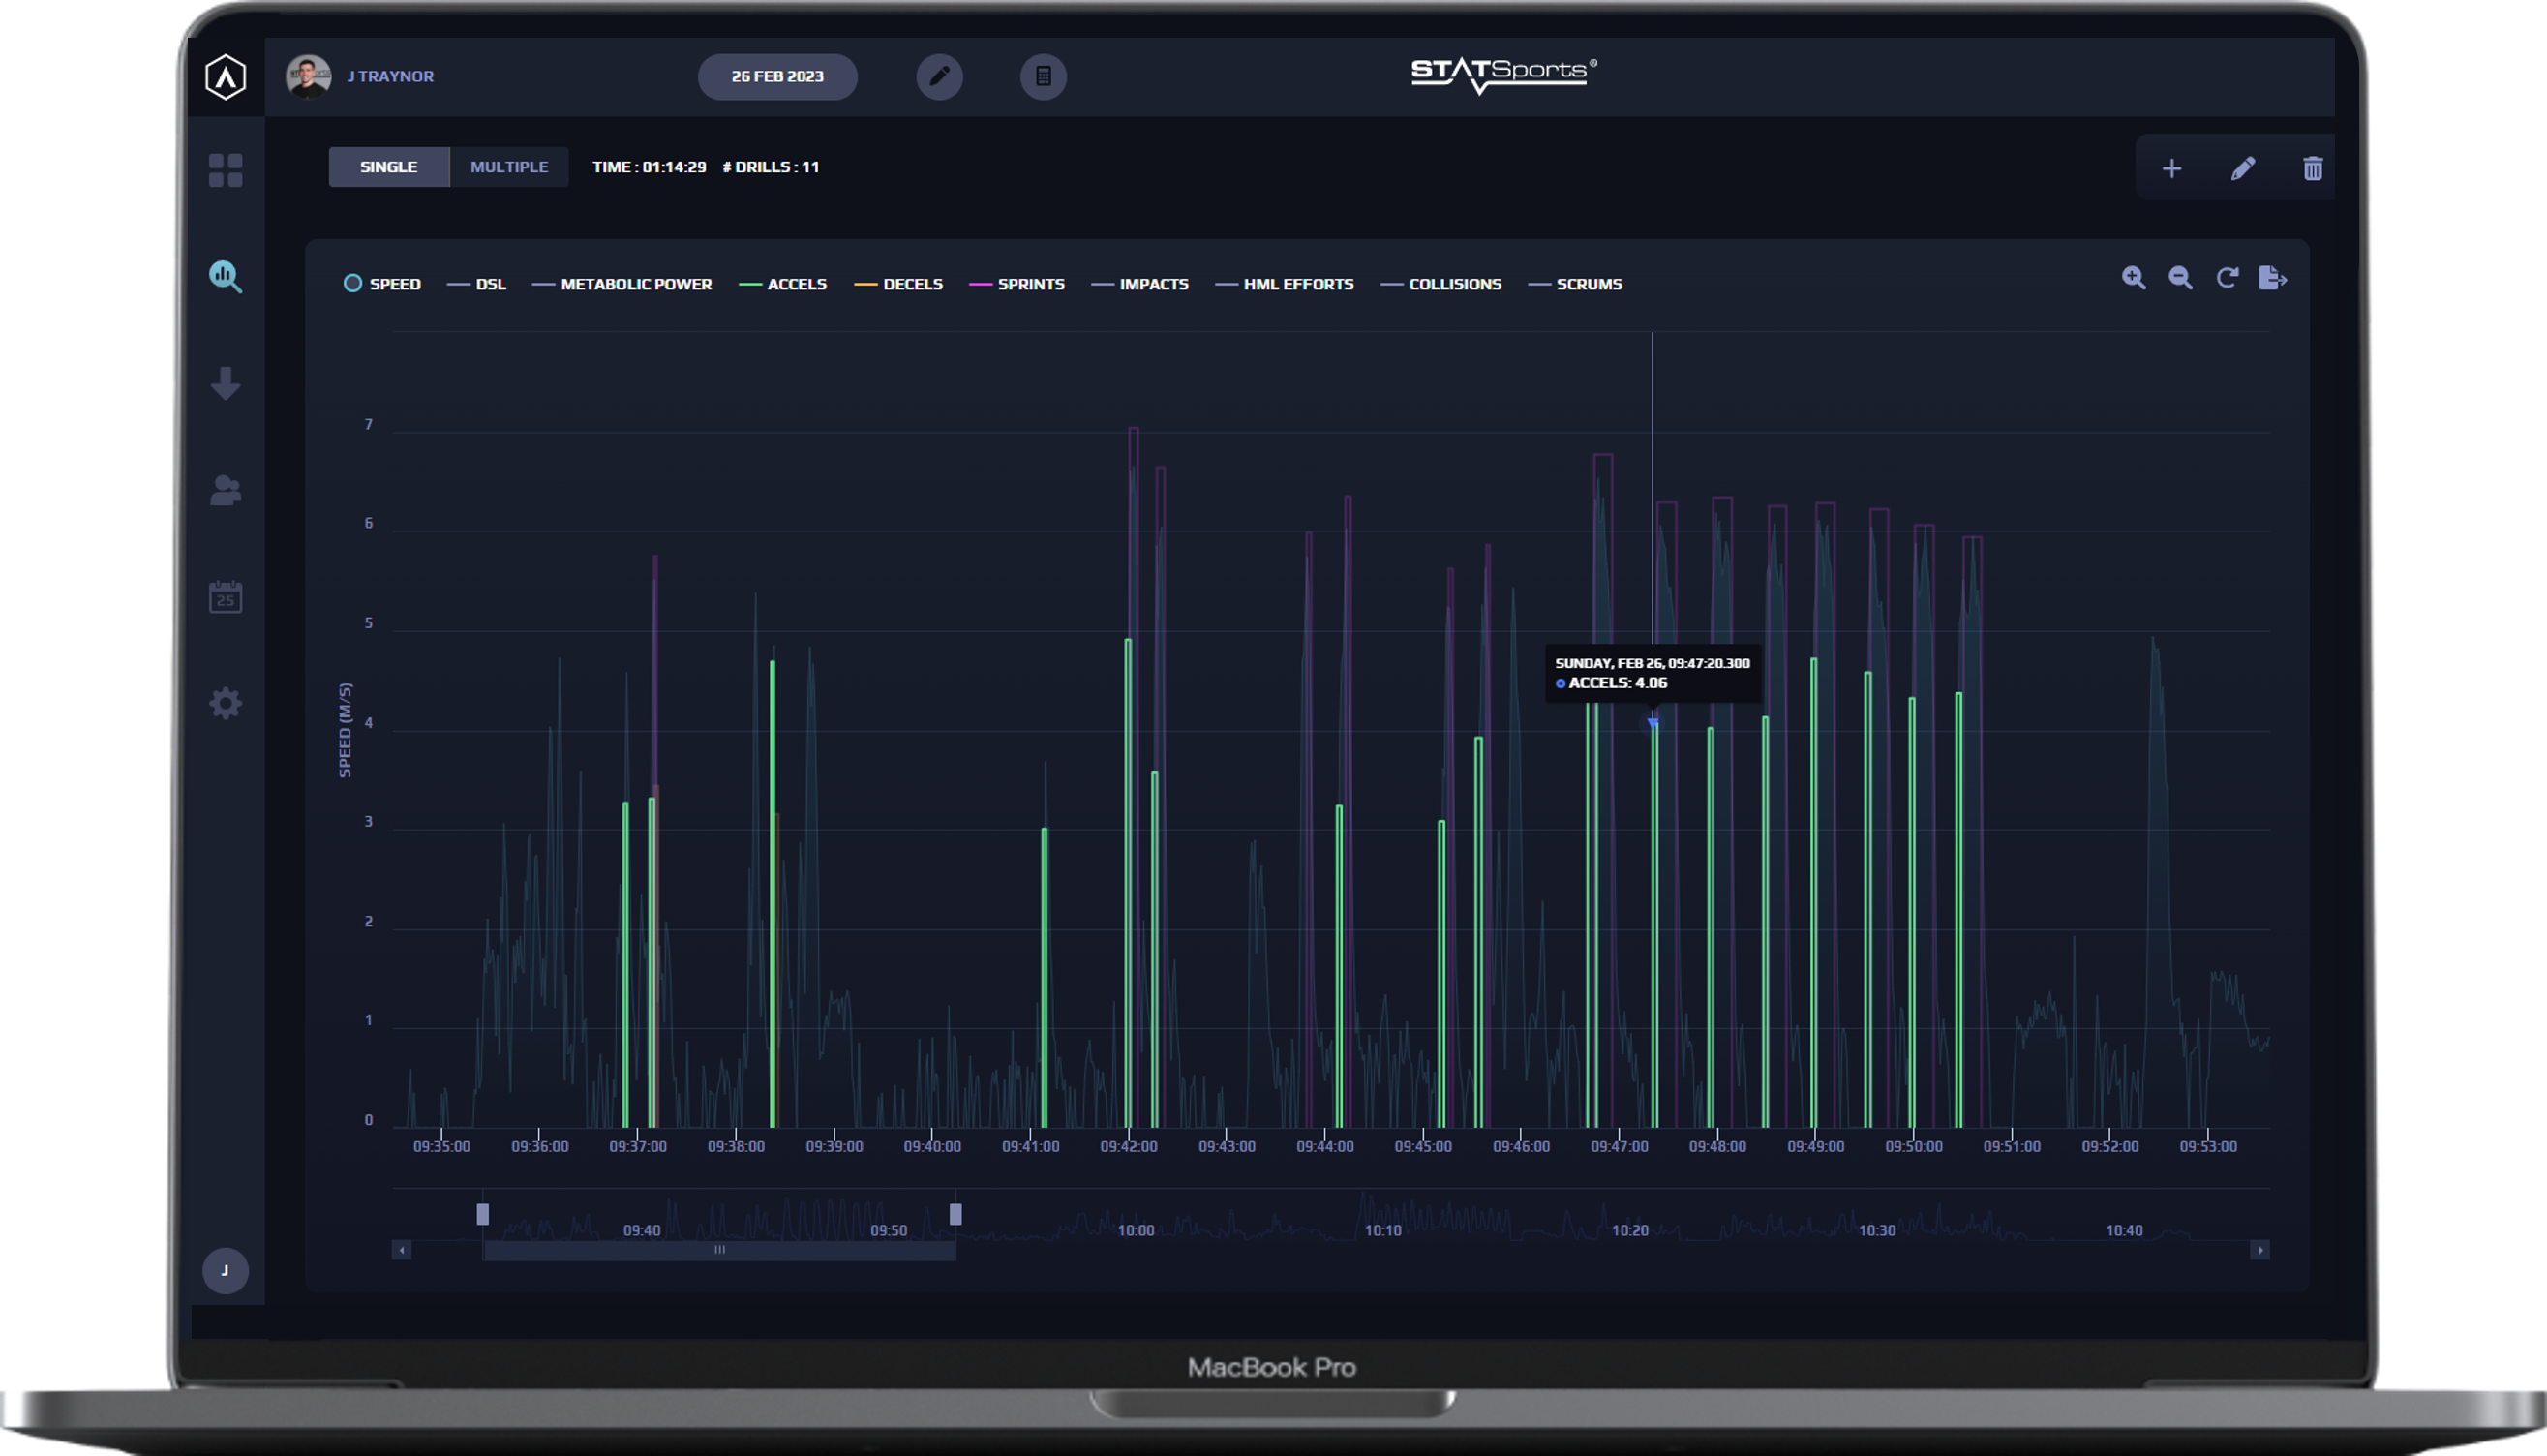
The Sonra Metric Event Exports feature allows users to export detailed information of each key action of the session, which can be interpreted to extract useful insights of the high intensity events performed by the athletes.
Metric Event Exports
Sprints
A CSV export containing the details of each sprint performed in the session. A sprint is counted whenever the player makes a run that exceeds the sprint entry speed (default set as 19.8 km/h) and maintains this speed for at least 1 second. The sprint’s entry speed, exit speed and minimum duration can be customized in the general settings and in the player profile. The following metrics are included in the report:
- Start and End time
- Time occurred since the last sprint
- Duration
- Distance
- Max Speed
- Average Metabolic Power
This report can be of particular interest when analyzing endurance- and speed-focused training drills. For example, in a repeated sprint exercise designed to build anaerobic capacity, the practitioner can know the details of the sprints to describe the performance of the athlete. Moreover, by knowing the match references, they can compare the training results to the benchmark and determine if the drill had the desired outcome.
The visual presented in Figure 1 shows the maximum speed reached in each effort of a repeated sprinting drill. In this visual, a reference line displays the player’s previous max speed and the details of each sprint is displayed in each column. This allows the user to report how each sprint was performed in reference to a target, expressed both as absolute and percentage.
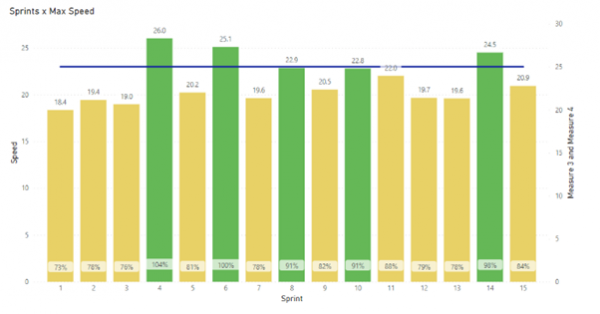
Figure 1: Maximum speed (columns) reached in each sprint and target maximum speed of the session (line) for an intermittent sprint training drill.
HML Efforts
A CSV export containing metric details of each of the High Metabolic Load Efforts. A HML Effort is described as any effort that exceeds the threshold of 25.5 W/kg. Using specific algorithms, speed and acceleration is used to calculate the metabolic power output of each running action. Therefore, an HML Effort is a reflection of all explosive movements that heavily requires the athlete’s rapid force production capacity. The metrics included in this report are:
- Start and End time
- Time occurred since the last HML effort
- Duration
- Distance
- Max Speed
- Average Metabolic Power
This information can be useful when analyzing an athlete’s ability to perform high quality, repetitive explosive efforts during a time period.
Using the information provided, the quality (duration, speed, average metabolic power) and quantity (number of efforts) of the efforts, as well as the ability to repeat these with little recovery time (time since last effort) can be analyzed to assess the athlete’s intermittent effort capacity.
Figure 2 shows the average time since last HML effort and the total distance covered in each 15-minute segment of a match. Using Sonra’s Segment Drills tool, the match data was divided into 15 minute splits and the HML Efforts event report was exported.
This visual represents the athlete’s capacity to repeat high quality explosive efforts throughout the match. In this case, we can see how the recovery time needed between efforts is increased and the total distance covered is decreased throughout the match.
Thus, we could interpret this as a lack of fitness from the player since they required longer recovery times between efforts and completed shorter or lower number of efforts in the final moments of the game.
It’s worth noting that the data by itself does not represent the absolute truth and more context should always be considered when analyzing data (changes in team tactics, match events, injury, weather, etc).
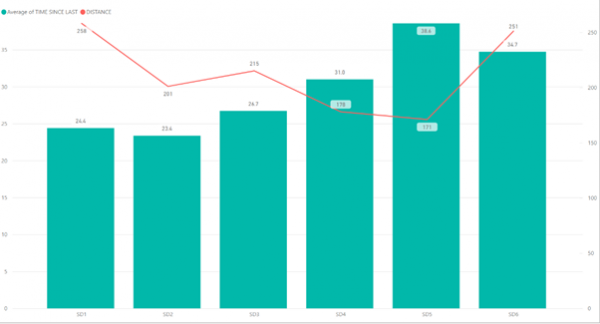
Figure 2: player’s average time since last HML effort (columns) and total distance covered in HML efforts (line) during each 15 minute period of a football match.
High Intensity Bursts
A CSV export containing metric details of each of the High Intensity Bursts. A High Intensity Burst is counted whenever an athlete performs at least 3 high intensity activities with each activity separated by no more than 20 seconds (default setting).
The high intensity activities can be accelerations, decelerations or impacts above zone 5. The configuration of HIBs can be customized in the settings section of Sonra Desktop, where the minimum number of high intensity activities required per burst, the time between activities, and minimum zone of acceleration, deceleration or impact can be customized.
The HIB event report contains the following metrics of each event:
- Start and End time
- Time occurred since last HIB
- Duration
- Distance
- Max Speed
Considering the type of actions that are calculated in a HIB, we can establish that the HIB is a reflection of the athlete’s capacity to endure high neuromuscular load with little time for recovery.
This is key aspect of sport-specific fitness that can be appreciated in moments such as 1v1 situations, where constant change of direction and pace is required to beat an opponent. Therefore, exposing players to more and longer HIBs can lead to improvements in force production and neuromuscular resistance.
An example for the application and visualization of HIBs is shown in Figure 3, where the average duration of HIBs of each drill of a training session is displayed.
This type of report allows the sports scientist to know the length of HIBs the athlete was exposed to in each drill, providing feedback on how effective each drill was to stimulate this aspect of training.
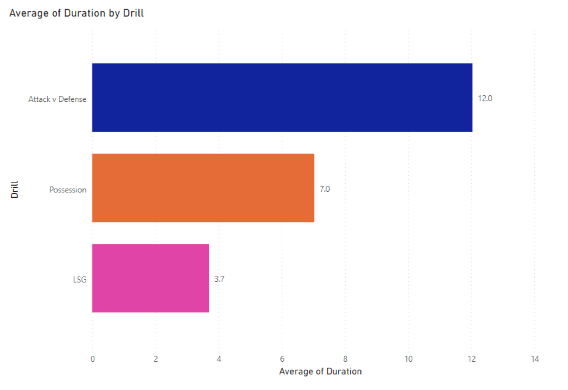
Figure 3: a team’s average duration of high intensity bursts (s) during each drill of a training session.
High Intensity Activities
A CSV export containing metric details of each of the High Intensity Activities. The High Intensity Activities are Accelerations, Decelerations and Sprints. The zone of the accelerations and decelerations shown in the report are defined by the active zones determined in Sonra Desktop settings. The sprints displayed are according to the sprint entry speed in the player profile and the sprint configuration established in Sonra Desktop settings. The metrics included in this report are:
- Start and End time
- Time since last activity (specific to the type of activity)
- Duration
- Distance
- Magnitude (only shown for accelerations and decelerations in m/s/s)
- Average Metabolic Power
- Dynamic Stress Load
Similar to the Sprints report, the HIA report allows us to extract high-detailed information about each event. These can be combined in a chart to display different metric values of a high intensity activity, for example, in Figure 4 where the magnitude, distance and duration of the accelerations completed in a training drill is displayed.
By combining different metrics in one chart, we are able to give a better visual representation of the performance of each acceleration.
This allows the practitioner to make important observations: the strongest accelerations in magnitude had lower distances covered and duration, acceleration #12 covered longer distance with shorter duration, among others.
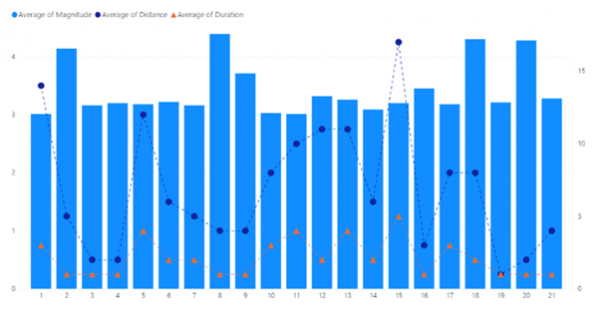
Figure 4: acceleration events during a training drill showing the magnitude (m/s/s), distance covered (m) and duration (s).
Rugby and Goalkeeper exports
Finally, another 3 metric event exports are available to produce specific reports. These include two rugby-specific outputs: the Collisions export, which describes details such as the collision load, time to feet and post collision acceleration during these events; and the Scrums export, which includes the impacts (for front, second and back lines), sync time, load, time to feet and post scrum acceleration for each scrum event.
Last, the Dives export is a report specific for football goalkeepers which includes detailed metrics for each individual dive: dive direction, time since last dive, dive power, load, return to feet, peak impact, max speed, acceleration, deceleration, dynamic stress load and total loading in each axis.
These reports are of specific interest for rugby teams and goalkeeper coaches, who can benefit from the detailed information of these high-intensity, crucial actions of the sport to fine-tune the physical performance of players, prescribe recovery protocols, reduce the risk of injury and improve the distribution of the training load.
Conclusion
The intention of this article is to inform the users of the Metric Event Exports tool and the applications and interpretations it can produce.
Metric event exports are detailed CSV reports that contain detailed metric information for each specific action during a session.
The use of metric event exports allows the practitioner to make a deeper analysis of the physical activities performed by breaking down each event in different metric outputs.
The data can be used to assess the athlete’s performance – their speed and endurance, ability to repeat explosive efforts, fitness level, force, and power, which can ultimately be interpreted to maximize athlete’s potential and reduce their risk of injury.
It is important for users to present the data in visual representations in order to easily identify trends, patterns and outliers.
A few examples of visualizations were given in this text, but these are only a display of the potential reports that can be produced with the datasets, since the presentation and interpretation of the data will be specific to each team or organization’s objectives and expectations.
Finally, it is worth highlighting the importance of considering the context of each training session or match before making conclusive statements of the data.
The results found in our reports will always be influenced by external factors such as training conditions, match strategies and events, and other players interactions, as well as internal factors such as fatigue, sleep, nutrition and readiness to train.
Taken together, the Metric Event exports are a valuable tool for sports scientists to extract valuable metric information that is not normally available in the regular exports and can be used to improve the monitoring of training load.
References
- Wisbey, B., Montgomery, P.G., Pyne, D.B. and Rattray, B., 2010. Quantifying movement demands of AFL football using GPS tracking. Journal of science and Medicine in Sport, 13(5), pp.531-536.
- Gabbett, T.J. and Ullah, S., 2012. Relationship between running loads and soft-tissue injury in elite team sport athletes. The Journal of Strength & Conditioning Research, 26(4), pp.953-960.
- Rossi, A., Perri, E., Trecroci, A., Savino, M., Alberti, G. and Iaia, M.F., 2016, December. Characterization of in-season elite football trainings by GPS features: The Identity Card of a Short-Term Football Training Cycle. In 2016 IEEE 16th International conference on data mining workshops (ICDMW) (pp. 160-166).