
18 Jul The Application of Squad/Individual period for Periodising Training Load
Introduction
Periodisation is the aim of optimising physical condition and reducing injury through systematic planning and varying training demands [1].
This periodisation model is used generally in both team and individual sports to provide a platform for athletes to perform at their highest level, especially when it comes to competition phase. The integrated use of technology to monitor this process and overall training load (TL) has grown rapidly in sport.
In recent years, due to a lack of quantification on external work performed by athletes, the introduction of GPS/GNSS monitoring devices has given practitioners the ability to quantify their athletes’ TL both internally (physiological response of the individual) and externally (TL prescribed by coaches) using a vast selection of metrics.
The STATSports system allows one to carefully look at these metrics to quantify and control the internal and external work of athletes during each training session. Both the Squad and Individual Period tab within Sonra is a useful tool to help analyse and understand what the overall TL was for a single week or any longer period of time.
This can then in turn provide some context to planning the following week’s TL so that coaches are able to prescribe a structured, periodized training plan that will expose athletes to the desired amount of volume and intensity in each training session.
Implementing into Daily Practice
Both the Squad and Individual period tab within the Apex Pro Series software can be found on the metric dashboard dropdown menu (Figure 1).
Both of these tabs can be broken down into a combo chart (combining and overlaying various metrics of your preference for each session) as seen in Figure 2 and various metric charts (range of visualisation charts for specific metrics).
These tools can be further broken down into a more numeric form in the metric table (Figure 3) which you can export to excel for further analysis.
The Squad and Individual Period tab essentially have the same concept, however squad period gives an average of TL for everyone within the selected session(s), whereas the individual period will show the total TL for just one player that the user has selected for that session(s).
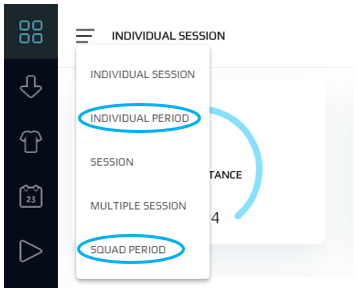
Figure 1. Squad/Individual Period Location
To fully utilize Squad period, one must first make sure the session is selected in the CALENDAR. To look at multiple sessions, you must turn on the MULTI SELECT icon and select your desired sessions.
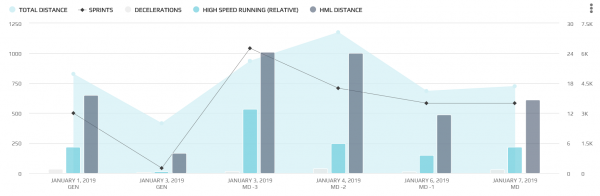
Figure 2. Squad Period Combo Chart – Example of the Squad Period combo chart. This section summarizes TL in a more visual format. In this format, the user has the ability to combine multiple metrics together in one chart, utilizing area, line and column charts with a maximum of 5 metrics at any one time.
This is exactly the same process for Individual period, however, you will have to select a single player from the player tab on the top left hand-side of the Sonra software.
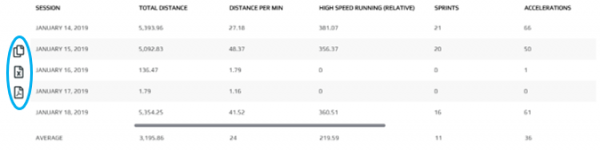
Figure 3. Individual Period Metric Table – Example of the Individual Period metric table that summarizes TL in numeric form for multiple sessions for an individual player. As a user you have the ability to also copy the displayed data straight into Microsoft Excel using the COPY button or EXPORT TO EXCEL to do some further analysis, as well as being able to EXPORT TO PDF. These options are circled on the left hand-side.
Within the combo chart, metric table and metric chart tabs in both Squad and Individual period, the user has the ability to configure what metrics they would like to analyse in any of these tabs by simply clicking on the CUSTOMIZE icon and selecting the relevant tab you would like to customize.
An example of this can be seen in the metric chart configuration tab in Figure 4. Here you can see that you have the ability to select multiple metrics and choose a specific chart type for each, such as bar, line and scatter to name a few.
The user has a maximum amount of 24 charts that he or she could add with a different metric to analyse in each and can also sort these charts by alphabetical order, max to min or by starting time.
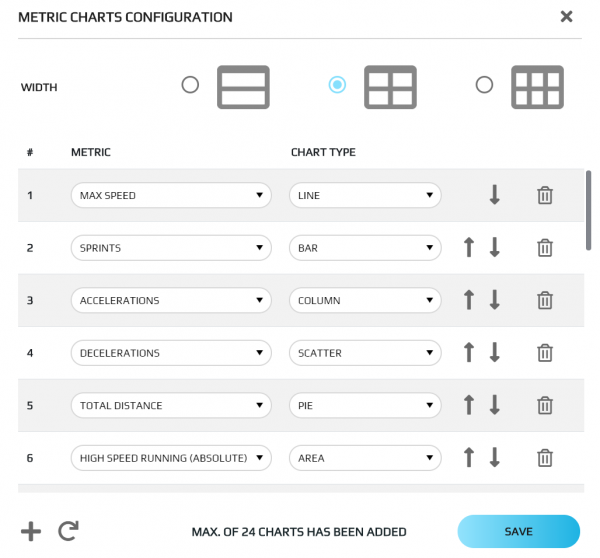
Figure 4. Metric Chart Configuration
The Apex Pro Series software also allows you to create a PDF Squad or Individual period report in our EXPORT DATA section.
The analyst will be able to have multiple templates with as many metrics in each of them, while being able to choose from various metric chart types like mentioned previously.
To produce the PDF report you would click GENERATE. It will then give you the choice of selecting specific drills within each session or the entire session(s) itself. Once you click SAVE you can save your PDF report and then start with your analysis.
Practical Applications
As a practitioner looking to periodise training, both the Squad and Individual period tabs in the STATSports software could be an extremely useful tool.
Let’s take a microcycle (training week block) in a team sport such as Soccer or Rugby for example. The aim here is to expose the players to a desired amount of TL each day throughout the week, so that they are physically prepared leading into the game.
This could mean that the practitioner could be varying the load of metrics he or she are looking to focus on each training day. It is preferred practice of sports scientists to vary the volume of certain metrics in an attempt to optimize physiological adaptation and limit the risk of injury leading into a game [2,3].
This approach is known as tapering. It is a fine balance between loading the players effectively to optimise positive adaptation without elevating that risk of injury.
The capability of the STATSports software to breakdown and visually see your chosen metrics over the course of a week is a feature which could provide more insight into prescribing the appropriate TL that will optimise this adaptation, and hopefully keep injury risk to a minimum.
Using TL data obtained from a senior elite Soccer team, we can see in Figure 5 the traditional tapering process of reducing total distance covered (metres) in the build up to a game.
MD-4 was the day after a travel day; the focus here was to shake off any travel fatigue that may have been experienced by the players, as well as to prepare the bodies for the more intense MD-3, aiming to keep the players at their peak condition.
Leading into MD-2 through to MD-1, we start to see a reduction in TL to increase player readiness leading into MD. The day after the game (MD+1) is a day off for the players to allow for full physical/mental recovery, as well as to prepare them for the next week of training and the next game.
(Metrics applicable to Soccer such as High Speed Running and High Metabolic Load Distance followed this trend also).
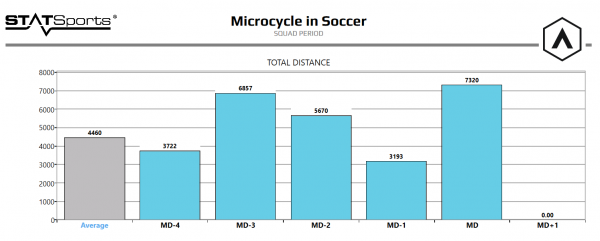
Figure 5. Typical Microcycle in Soccer
Conclusion
Overall, the Individual and Squad Period tabs are useful to provide some insight into both the internal and external workload that athletes are being exposed to, and to help with periodising training.
Utilizing the new Apex Pro Series Sonra software and our GPS/GNSS Apex device, it is clear to see how a practitioner can look at multiple internal and external metrics to breakdown each training day so that their athletes are in the best physical condition leading into a game.
For users of the system working in a team sport, it is advised to look at this model more specifically with each position to understand positional demands.
Utilizing the GROUP feature in the Apex system (explained fully in previous insight “A Sport Scientist’s guide to understanding and applying Thresholds in Sonra”), players can be added to a group by position which will help the user look at TL data more relatively for each position of the sport as quantifying the loads relative to competition demands is seen as an advantageous approach that can be used in this periodisation model [2].
References
- Malone, J. J., Di Michele, R., Morgans, R., Burgess, D., Morton, J. P., & Drust, B. (2015). Seasonal Training Load Quantification in Elite English Premier League Soccer Players. International Journal of Sports Physiology and Performance, 10, 489-497.
- Gomez Diaz, A., Bradley, P. S., & Casamichana, D. (2018). Quantification of a Professional Football Team’s External Load Using a Microcycle Structure. The Journal of Strength and Conditioning Research, 32(12), 1-8.
- Krespi, M., Sporis, G., and Trajkovic, N. (2018). Effects of Two Different Tapering Protocols on Fitness and Physical Match Performance in Elite Junior Soccer Players. Journal of Strength and Conditioning Research, 00(00), 1-10.