
25 Oct Instant Feedback on Drill & Player Outputs with Sonra Live’s New Data Views
Introduction
The latest update to the Sonra product suite sees the introduction of Player and Drill Comparison Tables to the Sonra Live iPad Application.
The purpose of the Player and Drill Comparison Tables are to provide applied practitioners with quick and effective feedback on the volume and intensity of selected metrics from a drill or multiple drills for selected players during a live training session.
Volume simply refers to the amount of work completed by a player during a drill or training session (e.g., total distance), while intensity refers to how hard that individual is working relative to time (e.g., distance per minute), and is often viewed against a pre-set threshold.
These features will enable practitioners to produce an extremely quick report on the session and provide feedback to technical coaches on the output of each training drill, which drills accumulated significant load, and which drills placed the greatest internal (e.g., average, or maximum heart rate) and external (e.g., total distance, distance per minute, etc.) demand on the players.
The new Drill Intensity feature within the Drill Comparison Table also provides practitioners with an efficient and powerful visualization of the intensity of each drill in relation to a pre-determined Drill Intensity Scale.
This Scale enables users to quickly view the squad average per drill for the selected intensity metric to ensure each drill meets the desired intensity.
Player Comparison Table
The Player Comparison Table provides a view of the outputs of all players for all completed drills within a live training session.
Within the table, each drill label is shown as the column header and each player, as well as an overall squad average are displayed in rows.
Users can select to view the outputs of all players or a chosen number of players within a pre-selected player group.
Practitioners can choose from all available Sonra Live metrics to display in the table by selecting one metric from the modal in the top center of the screen.
For example, practitioners can view the amount of High-Speed Running accumulated per player per drill by selecting one of the desired metric from the modal at the above table.
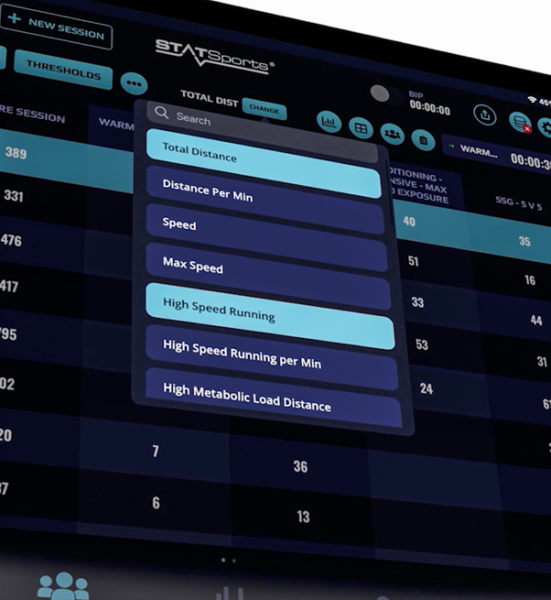
Figure 1 – Metric Selector on the Player Comparison Table.
Figure 2 displays the squad average and each individual player’s total distance accumulated during Entire Session, Warm-Up, and every 15-minute period during a competitive soccer match.
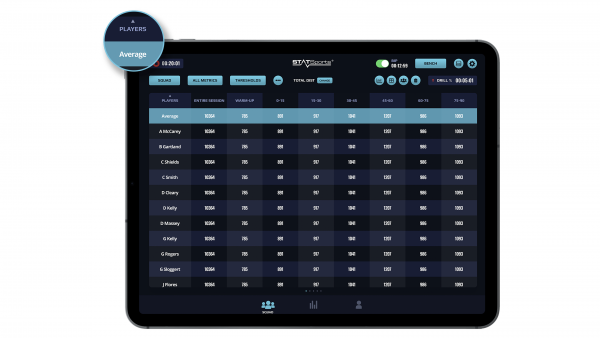
Figure 2 – Player Comparison Table displaying the Total Distance accumulated by each player during each drill.
Within an applied setting, many practitioners seek to adopt a model of tactical periodisation, where extensive training volume is predominantly accumulated early in the training week (micro-cycle) and as far away from the upcoming match as possible (e.g., MD -3) [1,2].
An extensive training focus prioritises large spaces, with the main aim of accumulating higher volumes of total distance, high-speed running distance and sprint distance [3].
Typical drills that are included on extensive focus days include large-sided games (e.g., 8v8, 10v10, etc.), drills focused on transition and counter attacking, as well as maximum velocity sprint efforts over 30-40 m [4].
The Player Comparison Table provides a fast, reliable, and effective tool for practitioners to monitor and feedback the output of each player within the squad, and for each drill across the training session.
For example, users are able to quickly identify which drills accumulated the greatest volume of sprint distance for each player and prioritise these drills on extensive focus training days to drive adaptation and reduce the likelihood of hamstring injury.
Practitioners can also combine the Sonra Live Thresholds feature to visualize drill outputs (e.g., distance per minute) as a percentage relative to a pre-determined Threshold value (Figure 2).
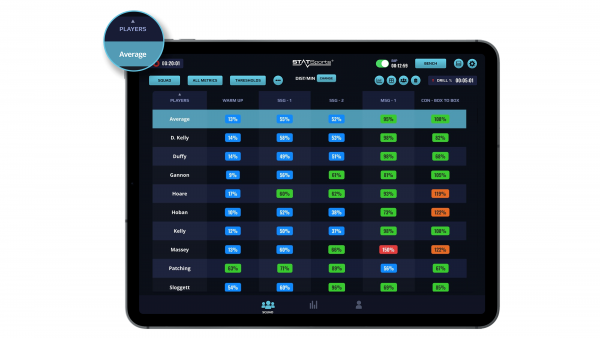
Figure 3 – Player Comparison Table displaying the distance per minute accumulated by each player during each drill as a percentage of a pre-determined Threshold value.
Drill Comparison Table
The Drill Comparison Table provides a comprehensive summary of the physical outputs derived from all completed drills.
Users can select to view the average of all players, sum of all players or the output of one selected player by using the modal in the top centre of the screen.
Users can also select to view all available Sonra Live metrics or a chosen number of metrics within a pre-selected Metric Category.
The Drill Intensity Scale, number of players included in each drill and duration of each drill are displayed in the first three columns of the table to provide additional context (Figure 3).
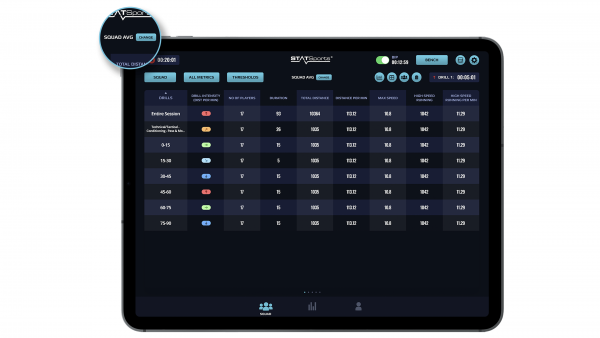
Figure 4 – Drill Comparison Table displaying the squad average for Total Distance, Distance Per Minute, Maximum Speed, High Speed Running (HSR) and HSR Per Minute.
Within the model of tactical periodisation, practitioners will seek to reduce volume as match-day approaches whilst simultaneously maintaining training intensity to prevent detraining and the potential risk of injury that arises when players are not regularly exposed to the intense demands of competition [1,5].
The Drill Comparison Table features a new and powerful visualization of the intensity of each drill relative to a pre-determined Drill Intensity Scale for one of three intensity metrics: Distance Per Minute, HSR Per Minute or HMLD Per Minute
Practitioners can utilise the Drill Intensity Scale to monitor the intensity of each drill relative to the average or peak demands of competition.
Mernagh et al., (2021) compared the whole match demands of EFL Championship match-play with ball in-play and maximum ball in-play (worst-case scenario phases of play) data, with ball-in play data excluding all match stoppages, providing a more precise analysis of match demands.
Maximum ball in-play data was significantly greater than whole match data for all metrics: distance per minute, high-speed running per minute, high metabolic load distance per minute, accelerations per minute, and decelerations per minute [6].
By setting the Drill Intensity Scale based on thresholds derived from maximum ball in-play data, practitioners can identify, design, and monitor drills that expose players to the peak demands of competition, therefore ensuring optimal physical preparation.
You can find more information on the Drill Intensity Feature here.
Author Details
Name: Alex Hart
Email: [email protected]
References
- Owen AL, Djaoui L, Newton M, Malone S, Mendes B. A contemporary multi-modal mechanical approach to training monitoring in elite professional soccer. Sci Med Footb. 2017;1(3):216–21.
- Clemente FM, Owen A, Serra-Olivares J, Nikolaidis PT, van der Linden CMI, Mendes B. Characterization of the weekly external load profile of professional soccer teams from Portugal and the Netherlands. J Hum Kinet. 2019;66:155.
- Taberner M, Allen T, Cohen DD. Progressing rehabilitation after injury: consider the ‘control-chaos continuum.’ BMJ Publishing Group Ltd and British Association of Sport and Exercise Medicine; 2019.
- Rebelo ANC, Silva P, Rago V, Barreira D, Krustrup P. Differences in strength and speed demands between 4v4 and 8v8 small-sided football games. J Sports Sci. 2016;34(24):2246–54.
- Nobari H, Barjaste A, Haghighi H, Clemente FM, Carlos-Vivas J, Perez-Gomez J. Quantification of training and match load in elite youth soccer players: a full-season study. J Sports Med Phys Fitness. 2021;
- Mernagh D, Weldon A, Wass J, Phillips J, Parmar N, Waldron M, et al. A comparison of match demands using ball-in-play versus whole match data in professional soccer players of the English Championship. Sports. 2021;9(6):76.