08 Dec Inside Poland’s Euro 2016 Qualifying camp with STATSports
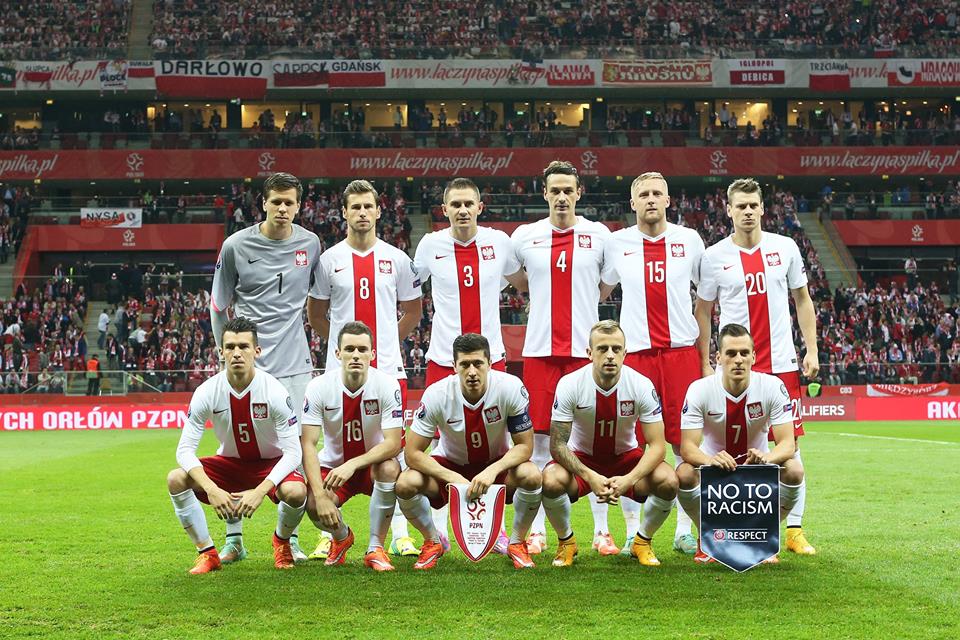
Poland kicked off their European qualification campaign in impressive fashion with victories over Gibraltar, Georgia and a first ever victory over the world champions Germany. They now lie at the top of group D, with sights now focussed on the Aviva showdown against Ireland in March. STATSPORTS has been at the heart of the Polish preparation in their quest for European qualification.
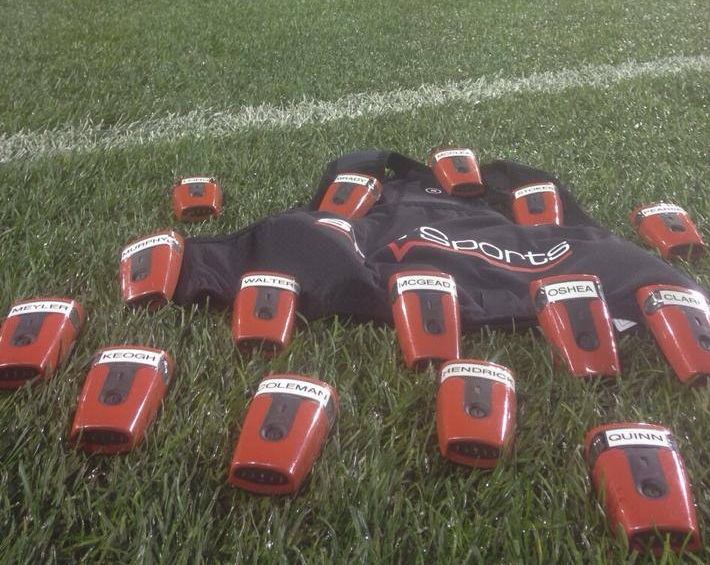
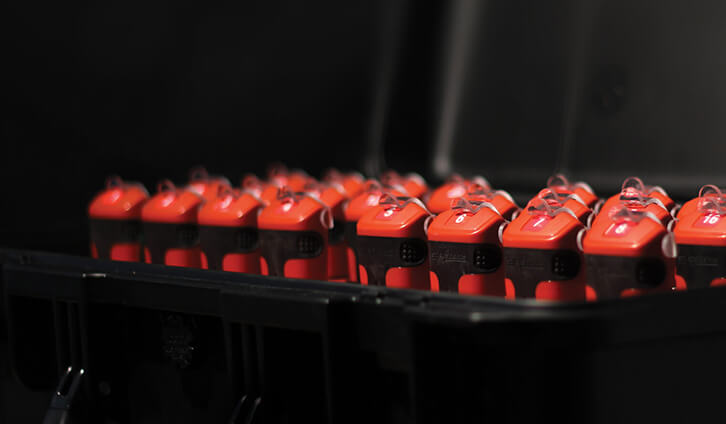
I have been providing GPS support to Poland for the last three international camps. STATSports Viper System has been an essential tool in their physical preparation for games and periodization plans. Using Statsports sports performance software, Poland have rejuvenated their preparation before games. The system allows us to plan, and report each individual’s physiological and kinematic response to training.
Benefits of using STATSPORTS during Poland’s training.
- Permits weekly and daily load management
- Monitors each individuals responses to training
- Allows player comparison during training
- Monitors fatigue levels
- Used as a tool to prevent injuries
- Monitors work rates during each drill
- Ability to set different thresholds for different training days
- Immediate feedback given via Viper live streaming.
Key metrics used
For each training session, we analyse 9 key metrics to monitor the team’s performance:
- Total distance (m)
- High speed running (HSR) (m)
- High metabolic load distance (HMLD) (m)
- Maximum speed (ms-1)
- Metres per minute (m)
- Accelerations (ms-2)
- Decelerations (ms-2)
- Dynamic stress load
- Fatigue index
During and after each training session, we use these key metrics to monitor each player’s performance and compare their training responses with actual game demands. Monitoring High-Speed Running involves the meters covered while travelling ≥ 5.5 ms-1 (19.8kph). Additionally, High Metabolic Load Distance represents High Speed Running as well as each players distance covered through accelerating and decelerating.
Both metrics, as well as Meters per Minute, represent our key markers for setting and analysing training intensity. As each position requires different physical demands, HMLD is also a useful tool in identifying which player is putting in the most effort without taking their total distance into consideration.
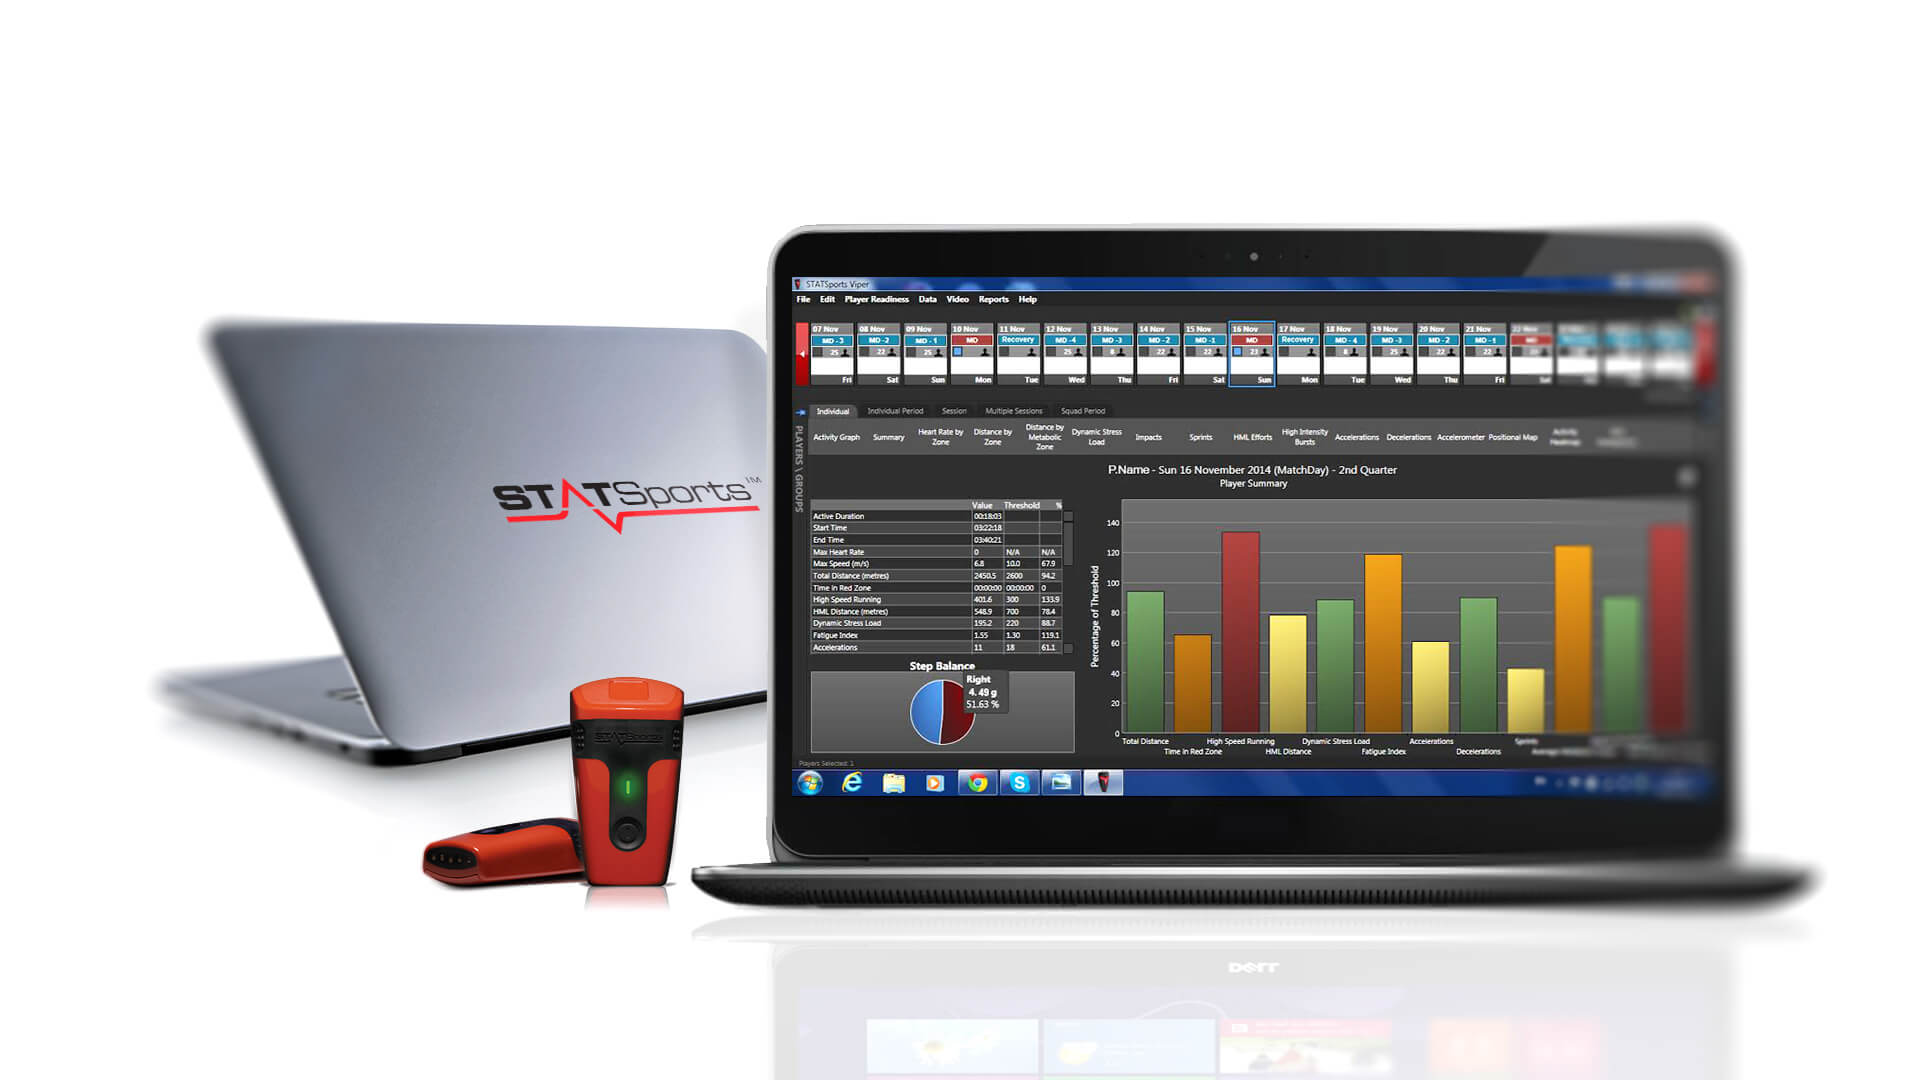
Closely monitoring Dynamic Stress Load (DSL) and Fatigue Index have been the two main reasons that we have had no soft tissue injuries reported since our Euro campaign has commenced. DSL represents collisions and step impacts above 2g, with each value depending on the players gait cycle.
Generally, as the training intensity increases so too does Dynamic Stress Load. However, if a player has a high DSL on the body and was not under high intense training conditions, it suggests that the player has not recovered from the previous session, or, he is at risk of injury.
A sample of an average squads distances and intensities during training and match day.
|
Metrics |
Light intensity |
Moderate intensity |
Match Day |
|
Total Distance |
2-4km |
5-6km |
10-12km |
|
High speed running |
50-100m |
100-250m |
≥500m |
|
Metres per min |
30-50m |
50-70m |
≥120m |
Periodization
The key to success is maintaining the balance between exposures to the training stimulus and allowing sufficient time to recover, sometimes less is better.
This balance can often be difficult to maintain with players arriving in a fatigued state from their club duties. This leaves minimal time for the players to train at high intense zones and gain a sufficient neuromuscular response for match day preparation.
The camps usually commence the Monday before game-day, with the focus being on low speed running during the first session in order to remove excess lactate in their blood system. As we progress through the week the focus shifts to meeting higher loads and intensities, up to game demand levels, without overreaching the players.
Of course, our physical goals and requirements alternate, depending on the squad and each individual’s fixture list. The Viper system live streaming and drill analysis has been crucial to our periodisation plans.
Drill analysis
By using drill analysis, we can break down our session and into various sections and view the different demands required for each drill. This permits us to carefully manage our training load. The objective data can then be used to categorise the drills according to their intensity.
Once we know the physical demands of each drill, we can organise and plan our training sessions for the week depending on the necessary load needed. Additionally, we use Drill Analysis to longitudinally monitor each player’s physical condition and to identify individual progression.
Viper live streaming
Viper live streaming has allowed our players to perform to their physical potential. Live streaming allows us to analyse training impact in real-time pitch side. Once we set our desired loadings, we can compare our individual loading to the actual real time data.
For example, on the day before a game, retrospective analysis on a player might have shown too many accelerations/decelerations, therefore, resulting in excess eccentric loading, potentially, causing the player to be in a fatigued condition for the game. With Viper live streaming, we can indicate when each player has reached their threshold, and we can take necessary precautions if needed.
For more unique insight’s into Elite sports teams make sure to like us on Facebook and follow us on Twitter
Niall Cafferkey, Sports Scientist.