24 Mar Sonra GK: Utilising Sonra Goalkeeper Analysis to Monitor Goalkeeper-Specific Activities
Introduction
Traditionally, goalkeepers tend to be somewhat overlooked in the literature in relation to load monitoring and game demands, as they are often excluded from the analysis in favour of focusing entirely on field players.
Unsurprisingly, research quantifying game demands which did include goalkeepers in the analysis found that goalkeepers covered significantly less Total Distance than field-based players, while performing significantly fewer high-intensity actions [1].
Conversely to outfielders, goalkeepers will typically perform significantly higher workloads during the training week than they are likely to be exposed to on game day in terms of explosive activities such as accelerations and decelerations [2].
As such, practitioners should consider adjusting the approach to load monitoring with goalkeepers than with outfield players.
Additionally, traditional distance-based metrics are less applicable to goalkeepers due to the position operating in a more restricted playing area.
Goalkeeper-specific metrics which account for the explosive actions these athletes perform over short distances in a more specific context would be most appropriate for describing training load.
Goalkeeper specific metrics may also aid practitioners in identifying asymmetries in diving performance, with goalkeepers typically exhibiting preferred diving sides [3].
Sonra GK
In the STATSports Sonra software, data from any Apex unit can be downloaded in “GK Mode”.
Once downloaded in GK Mode, goalkeeper specific metrics will be calculated for the relevant session, in addition to the full 250+ metrics available in a standard download.
Users can specify for selected players to download as GK automatically or turn off GK features for certain training days where a standard download is most appropriate (e.g. aerobic fitness session).
GK sessions will be indicated by a net icon on the session selector and will display GK metrics by default in dashboards.
Furthermore, all GK metrics are available in Sonra’s Custom Metric Calculator, meaning practitioners can take the existing GK metrics and create their own bespoke metrics.
The GK metrics currently available in Sonra are; Total Dives, Dives Left, Dives Right, Average GK Power, GK Load, Return to Feet, Average Time Since Last Dive and Average Dive Impact.
Dives
The Sonra software uses the data obtained from the Apex devices inertial sensors to identify when a goalkeeper has performed a dive and determines the direction.
This can be used to display an absolute count of the Total Dives performed either throughout a range of drills in a session, a range of training days throughout the week, or to compare outputs from multiple goalkeepers in a single session.
This information can be useful in describing not only the load incurred across training days, but also at the individual drill level to inform session design.
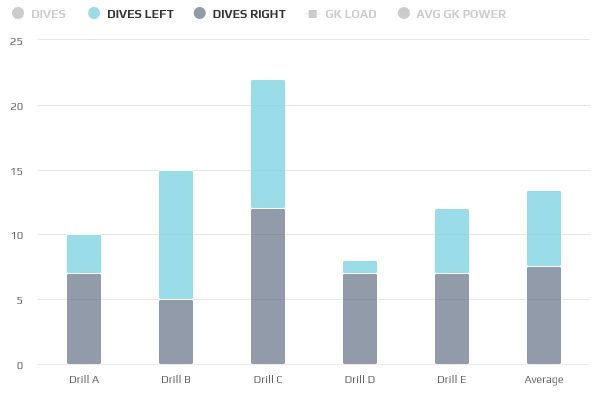
Figure 1. Total Dives Completed in a Single Session Divided into 5 Chronological Drills.
Average GK Power
Average GK Power is based on the principle of mechanical power and is reported during each dive in joules.
The Average GK power indicates the intensity of take-off or flight phase of each dive and reports it an average across the selected range of sessions or drills.
GK Power can also be reported per individual dive. Average GK Power has potential to be used as an estimate for the onset of fatigue in a session, as Figure 2 might suggest.
Furthermore, Average GK Power could be used to assess the output in a maximal effort in either direction to highlight any asymmetries which may exist.
However, it should be considered that the dive response of a goalkeeper is proportionate to the stimulus they are exposed to (i.e shot/serve), so a decrease in output could simply be due to the demands of the drill.
Longitudinal data collection would allow practitioners to establish normative values for particular drills and potentially use this data to inform practice.
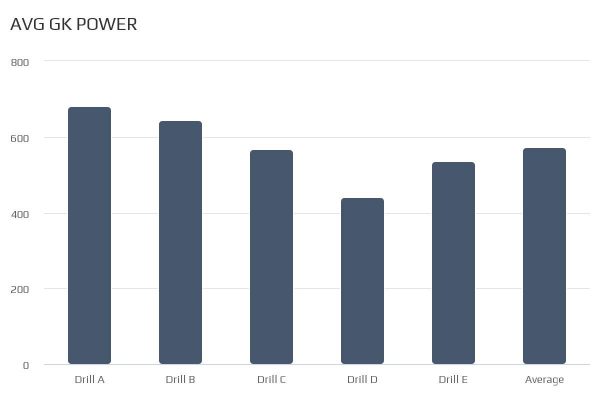
Figure 2. Average GK Power Over 5 Drills in Chronological Order.
GK Load
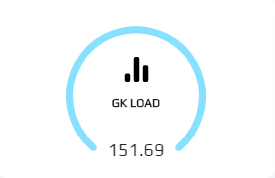
GK Load is an arbitrary, external load score calculated during goalkeeper specific events only, effectively quantifying the loading experienced during all dives. GK Load is calculated based on several key factors during the dive, such as the peak acceleration leading into the dive, impact at ground contact and the return to feet effort post impact. This value can be used as cumulative loading score per session and should monitored at an individual level.
Return to Feet
Return to Feet is simply the time taken to return to an upright position following ground contact and can be viewed per individual dive effort.
These values can be exported via a .csv export and used as a performance marker where appropriate, such as drills with a high emphasis on recovering position following an explosive effort.
Average Time Since Last Dive
Average Time Since Last Dive takes the time period selected by the user to give an indication of the frequency dives are occurring within a session or drill to indicate the dive response a session or drill design will stimulate. This value is reported in seconds.
GK Dashboards
Sonra allows users to create powerful dashboards to visualise data directly after download. When the session is downloaded as GK, the default dashboard view focusing on GK metrics.
The user can customise the GK dashboard however to incorporate any metric they wish. These visualisations can offer a quick snapshot of a session demands in terms of the absolute volume, drill by drill comparisons or view against a player’s threshold values.
Furthermore, with a variety of view types, practitioners can illustrate GK performance longitudinally to compare against previous sessions, or compare multiple goalkeepers within a single session (see article https://pro.statsports.com/sonras-advanced-data-visualization-tools/).
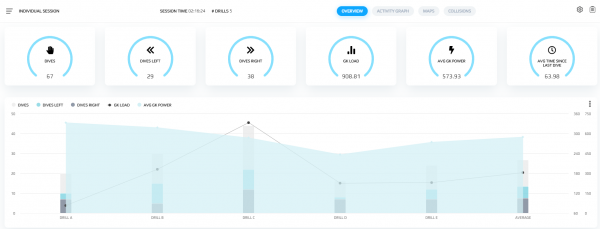
Figure 3. Sonra’s Individual Session GK Dashboard – Gauge & Combo Chart View.
References
- Di Salvo, V., Benito, P., Calderon, F., Di Salvo, M. and Pigozzi, F. (2008). Activity Profile of Elite Goalkeepers During Football Match-Play. The Journal of Sports Medicine and Physical Fitness, 48, (4), 443 – 446.
- Moreno-Perez, V., Malone, S., Sala-Perez, L., Lapuente-Sagarra, M., Campos-Vazquez, M.A. and Del Coso, J. (2019). Activity Monitoring in Professional Soccer Goalkeepers During Training and Match Play. International Journal of Performance Analysis in Sport, 20, (1), 19 – 30.
- Knoop, M., Fernandez-Fernandez, J. and Ferrauti, A. (2013). Evaluation of a Specific Reaction and Action Speed Test for the Soccer Goalkeeper. Journal of Strength and Conditioning Research, 27, (8), 2141 – 2148.