11 Mar Stadium Data – An Eredivisie Report
Introduction
Global Navigation Satellite System (GNSS) technology deployed in the STATSports Apex device has previously demonstrated high levels of data quality when operating in challenging environments, such as semi-enclosed stadia or high residential/commercial complexes where signal reception may be compromised.
GNSS technology can communicate with multiple satellite systems (GPS, GLONASS, Galileo, and BeiDou) simultaneously, and thus provides more accurate positional information through increased satellite availability.
Regional Satellite-based Augmentation Systems (SBAS) further improves the accuracy and reliability of GNSS information by correcting signal measurement errors, adjusting for atmospheric conditions and providing information about satellite accuracy, integrity, and availability.
SBAS uses GNSS measurements taken by accurately located reference stations deployed across an entire continent [1].
For standard commercially available GPS Systems, architecture and infrastructure in and around stadium locations can present problems for the accuracy of data captured, as well as the calculation and transmission of live data.
Johnston et al [2] demonstrated significant discrepancies between GPS providers when used in challenging stadiums determined by the mean number of satellites connected during match activities.
The same study showed that the STATSports Apex device, utilising augmented GNSS, connected to an average of 17.7 satellites during NRL games compared to single constellation GPS devices, which recorded an average of 10.5 satellites in AFL match-play.
Following on from the English Premier League stadium data report, this article will explore the data quality of the STATSports Apex device in stadium environments during the 2020/21 Eredivisie season.
Methodology
Data was provided by our partners FC Utrecht, who competed in 18 different Eredivisie stadiums over the course of the 2020/21 season.
A sample of 13 outfield players was taken from each game.
All primary positional groups were covered i.e. defender, midfielder and forward.
This included wing positions which has been shown to collect the poorest quality in data [5].
Each player was equipped with an Apex GNSS Device before the start of each match.
The devices were switched on approximately 20 minutes before the warmup.
This device was worn in a custom fit garment provided by STATSports.
The same device was worn by the same player throughout the season to minimize any potential inter-unit variability.
The quality of the data was determined by recording the horizontal dilution of precision (HDOP), horizontal accuracy (HACC), and the number of satellites available.
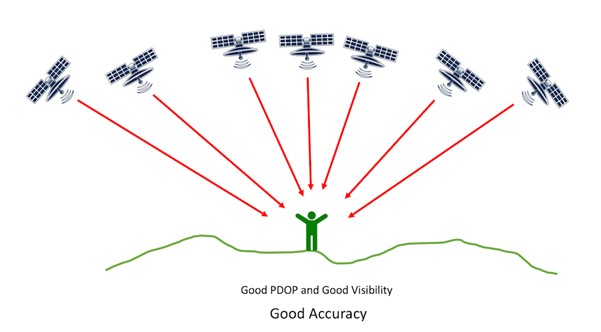
Figure 1. Good Position Dilution of Precision (PDOP) and good visibility Indicated by satellites spread evenly throughout the sky.
HDOP – Dilution of Precision is a term used to describe the strength of the current satellite configuration, or geometry, on the accuracy of the data collected by a GPS or GNSS receiver at the time of use.
HDOP is a factor in determining the relative accuracy of a horizontal position [4].
With GPS receivers, when satellites are grouped together in the same general area of the sky, the satellite geometry is considered to be weak (higher DOP value).
When satellites are evenly spread throughout the sky (Figure 1), their geometry is considered strong (lower DOP value).
Thus, the more satellites available spread evenly throughout the sky, the better our positional accuracy will be (and the lower the DOP value).
HACC – represents the error of measured position compared to the absolute position of the receiver, projected in the horizontal plane.
In Apex, HACC is represented by a number between 0 and 7.
Values below 1 are considered military level of precision (less than 0.5m error), values below 5 are considered good (less than 2m error).
No. of Satellites – The total number of satellites used in the calculation of the unit’s position.
The data used for analysis accounts only for players who participated in the full game, with all data generated during the half-time period being excluded from the analysis.
The satellite information associated with each player’s positioning throughout the session was logged at a frequency of 10Hz.
The Raw Data Extended file (Figure 2) was exported from Sonra and analysed in Microsoft Excel, where descriptive statistics were produced and mean HDOP, HACC, No. of Satellite values reported.
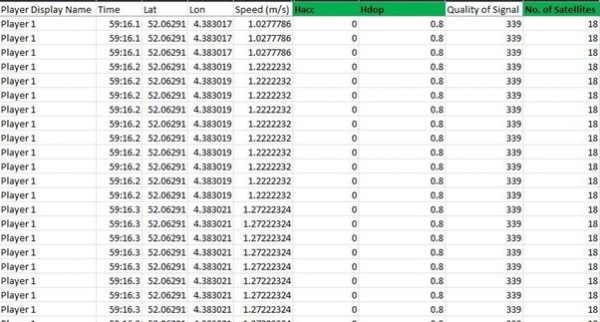
Figure 2. Raw Data Extended file from Sonra showing metrics of interest, highlighted in green.
Findings/Results
Figure 3 shows a comparison of the average satellite count for a single game in each Eredivisie stadium.
The average number of satellites across all stadiums was 21 ± 1.6.
The stadiums that reported the highest average number of satellites of 24 was observed at the Mandemakers Stadion (RKC Waalwijk) and the Philips Stadion (PSV Eindhoven).
The stadium that reported the lowest average number of satellites (18) was the Johan Cruijff Arena (Ajax).
This would suggest that the Apex device had sufficient satellite availability to produce high quality data when deployed in all 18 Eredivisie stadiums.
This observation shows that it is above the minimum requirement of 6 satellites for adequate signal strength [6].
Due to the GNSS technology, it further improves the signal strength in these enclosed stadiums providing further confidence to practitioners on the quality of this data.
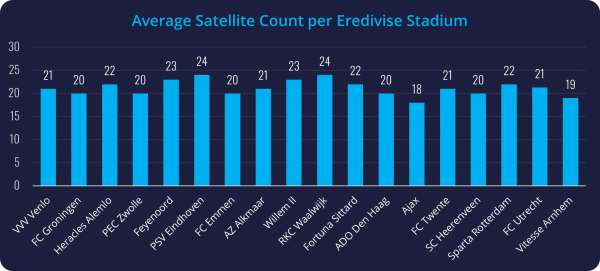
Figure 3. Comparison of the Average Satellite Count per Eredivisie Stadium
The data in Table 1 (below) shows how the Apex device performed in each stadium, as determined by the three previously identified satellite related metrics.
Data quality was best, as indicated by the minimum HACC and HDOP values, in the Mandemakers Stadium with 0.4 HACC and 0 HDOP values respectively.
The mean HACC and HDOP values across all Eredivisie stadia were 0.11 ± 0.32 and 0.49 ± 0.25.
Both the mean HACC and HDOP values observed are classified as military accepted levels of precision.
No significant differences were found when comparing the satellite quality data across each of the primary positional groups.
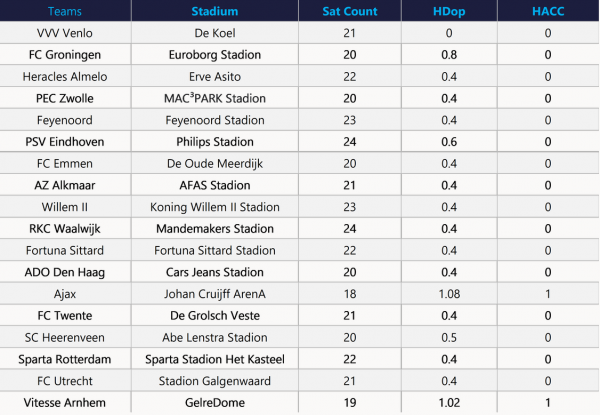
Table 1. Comparison of the Average HACC,HDOP and No. of Satellites in Eredivisie Stadiums.
Conclusion
As the Sonra Software allows the provision of raw data provided in the extended Raw Data export, users have the ability to analyse and manipulate their data whatever way they choose without restriction, affording practitioners the ability the scrutinise the quality of the data recorded.
The CSV format of the export facilitates importing to any number of third party platforms, enabling more in-depth analysis or visualisation of the data.
Currently there is limited research available in the literature on GNSS satellite quality in stadium environments in a sporting context.
Further study is required to determine the data quality obtained in competitive match play from GNSS devices.
As can be seen from the data collected during the 2020/21 Eredivisie season, the APEX device provided accurate and reliable data, as determined by the average number of satellites, HACC and HDOP values, throughout 18 stadiums.
STATSports are committed to data transparency and will continue to produce stadium data quality reports across various leagues using the Apex device.
Client Testimonial
At FC Utrecht, we want to make sure we leave no stone unturned when it comes to our data & technology.
Our partnership with STATSports has allowed us to better manage training load and physically develop resilient and robust players ready to meet and exceed demands.
A key part of this includes the data captured in challenging (stadium) environments, both live and post-event.
Working alongside each other for five years now, it quickly became apparent that STATSports delivers world-leading standards for data accuracy, reliability, and consistency.
On a daily basis, our coaches make data-informed decisions regarding drill or training design, based off our players’ match demands.
– FC Utrecht Performance Department

References
- GISGeography (2019). GPS Accuracy: HDOP, PDOP, GDOP, Multipath & the Atmosphere. Retrieved June 17, 2020, available: https://gisgeography.com/gps-accuracy-hdop-pdop-gdop-multipath/
- Johnston, R. D., Thornton, H. R., Wade, J. A., Devlin, P., & Duthie, G. M. (2020). The Distribution of Match Activities Relative to the Maximal Mean Intensities in Professional Rugby League and Australian Football, Journal of Strength and Conditioning Research, 1., available: https://doi.org/10.1519/jsc.0000000000003613
- Fédération Internationale de Football Association (2019). FIFA Quality Performance Reports for EPTS. Retrieved June 17, 2020, available: https://football-technology.fifa.com/en/media-tiles/fifa-quality-performance-reports-for-epts/
- European Union Agency for the Space Programme (2019). Galileo and EGNOS featured at InterGeo 2019. Retrieved June 17, 2020, available: https://www.gsa.europa.eu/newsroom/news/galileo-and-egnos-featured-intergeo-2019
- Shergill, A. S., Twist, C., & Highton, J. (2021). Importance of GNSS data quality assessment with novel control criteria in professional soccer match-play. International Journal of Performance Analysis in Sport, 21(5), 820-830.
- Malone, J. J., Lovell, R., Varley, M. C., & Coutts, A. J. (2017). Unpacking the black box: applications and considerations for using GPS devices in sport. International journal of sports physiology and performance, 12(s2), S2-18.
Author Details
Account Management Dept.
Andrew Morrissey
Account Director