24 Jan Stadium Data – A Premiership Rugby Report
Introduction
Global Navigation Satellite System (GNSS) technology utilised in the STATSports Apex device has previously demonstrated high levels of data quality when operating in the most challenging environments, including semi-enclosed stadia or high-rise residential/commercial complexes where signal reception may be significantly compromised.
GNSS technology is capable of communicating with multiple satellite systems (GPS, GLONASS, Galileo, and BeiDou) simultaneously, thus maximising the accuracy of positional data through increased satellite availability.
Regional Satellite-based Augmentation Systems (SBAS) further improves the accuracy and reliability of GNSS information by correcting signal measurement errors and providing information about its accuracy, integrity, and availability.
SBAS utilises GNSS measurements derived from accurately located reference stations deployed across an entire continent [1]. For alternative GPS Systems that are available commercially, architecture and infrastructure including stadium structures and TV streaming equipment can present problems for the accuracy of data captured as well as the calculation and transmission of live data. Johnston and colleagues [2] demonstrated significant discrepancies between GPS providers when examining the mean number of satellites obtained during match activities within challenging stadium environments.
This study highlighted that the STATSports Apex device, powered by augmented GNSS technology, connected to an average of 21.62 satellites during Premiership Rugby Union matches. In comparison, an alternative player tracking technology provider, powered by single constellation GPS technology, was only able to record an average of 10.5 satellites during Australian Football League match-play [2].
This insight is the first of its kind carried out across rugby union, and aims to build on the findings of the English Premier League, Dutch Eredivisie, Portuguese Primeira Liga and Austrian Bundesliga STATSports stadium data reports in order to identify the data quality of the STATSports Apex device in stadium environments throughout the 2021/22 Gallagher Premiership Rugby Season.
Methodology
Data was provided by STATSports partners Northampton Saints, who throughout the course of the 2021/22 Premiership season competed in 13 different stadiums.
A sample of 22 players was taken from each competitive fixture. All primary position groups were covered including front row, second row, back row, half backs and back three to ensure any potential variation between positions was accounted for in the data analysis. Each outfield player was equipped with a STATSports Apex GNSS device. Before the start of each match, the devices were turned on approximately 20-minutes prior to the start of the warmup. The same device was worn by the same player throughout the entire competitive season to minimize inter-unit variability.
The quality of the data was determined by recording the horizontal dilution of precision (HDOP), horizontal accuracy (HACC), and the number of satellites [3].
HDOP – Dilution of Precision is a term used to describe the strength of the current satellite configuration, or geometry, on the accuracy of the data collected by a GPS or GNSS receiver at the time of use.
HDOP – is a factor in determining the relative accuracy of a horizontal position. With GPS receivers, when satellites are grouped together in the same general area of the sky, the satellite geometry is considered to be weak (higher DOP value).
When satellites are evenly spread throughout the sky, their geometry is considered strong (lower DOP value). Thus, the more satellites available spread evenly throughout the sky, the better our positional accuracy will be (and the lower the DOP value).
HACC – represents the error of measured position compared to the absolute position of the receiver, projected in the horizontal plane. In APEX, HACC is represented by a number between 0 and 7. Values below 1 are considered military level (less than 0.5m error), values below 5 are good (less than 2m error).
Number of Satellites – is the total number of satellites used in the calculation of the unit’s position. The data used for analysis accounts only for players who participated in the full game, with all data generated during the half-time period being excluded from the analysis.
The satellite information associated with each player’s positioning throughout the session was logged at a frequency of 10Hz. The Raw Data Extended file was exported from STATSports’ Sonra performance analysis platform and analysed in Microsoft Excel where descriptive statistics were calculated and reported as an average.
Results
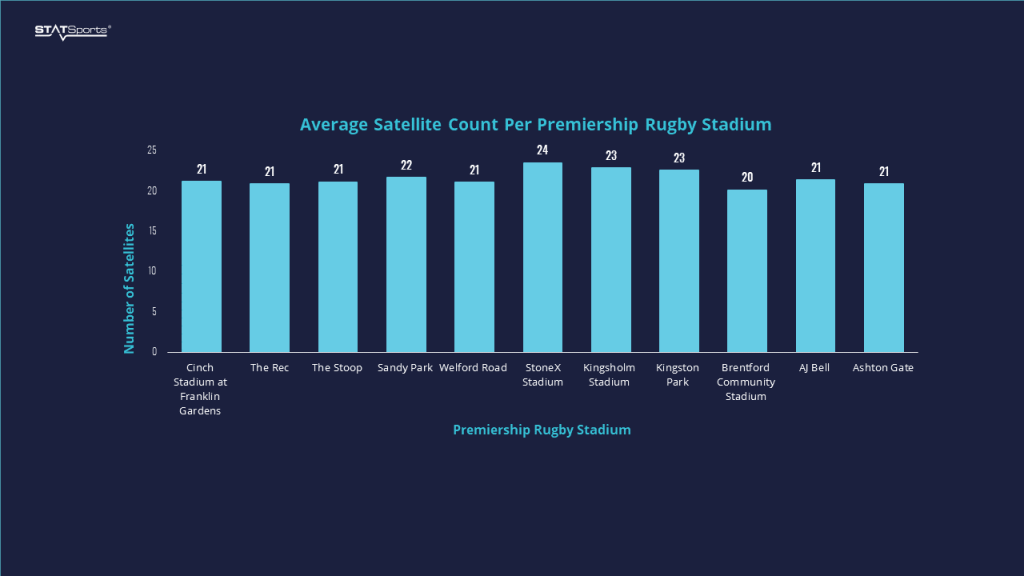
Figure 1. Average Number of Satellites across Premiership Rugby Stadiums.
Figure 1 illustrates a comparison of the average satellite count for a single game in each of the Premiership Rugby stadiums. The stadium that reported the highest average number of satellites (23.57) was StoneX Stadium, home of Saracens.
The stadium that reported the lowest average number of satellites (20.19) was Brentford Community Stadium, home of London Irish RFC. Although the lowest value recorded, this value can still be considered extremely good, thus practitioners can have the upmost confidence in the integrity of the data collected. The average number of satellites across all stadiums was 21.62 ± 1.95.
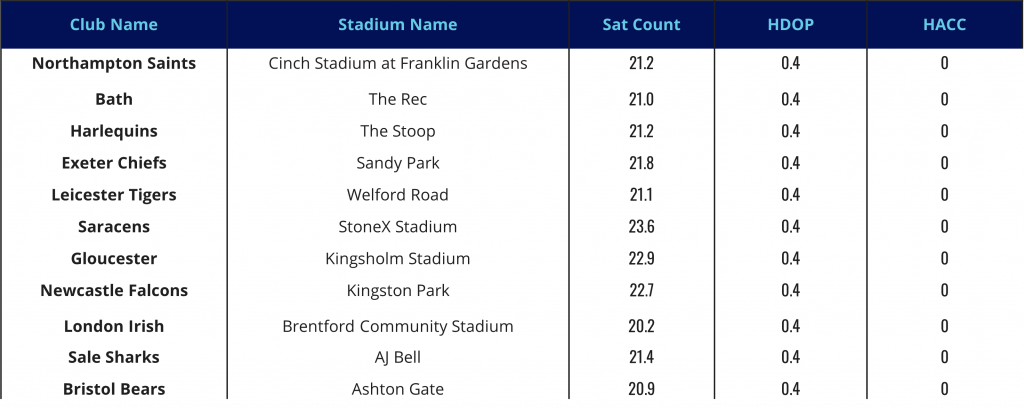
Table 1. Average Number of Satellites, HDop & HACC across Prremiership Rugby Stadiums.
Table 1 demonstrates how each stadium has performed as determined by the average satellite count, HDOP, and HACC. All of the stadiums in the Rugby Premiership reported 0.4 HDOP and 0 HACC values, respectively.
The average HDOP and HACC values across all Premiership Rugby stadia were 0.4 ± 0.0 and 0.00 ± 0.0, respectively. Each of these values are recognised as military accepted levels of accuracy. In addition, no significant differences were found when comparing satellite data quality across each of the primary position groups.
Conclusion
STATSports are, and will continue to be, committed to data transparency with all data collected using the STATSports Apex system.
The Sonra performance analysis platform enables users to export all raw data collected by Apex devices; providing users with the opportunity to analyse and manipulate their stadium data in whatever way they choose without restriction.
As can be seen from the results of this report, the STATSports Apex device provided accurate and reliable data, as determined by the average number of satellites, HDOP, and HACC values throughout all Premiership Rugby stadiums.
Further research aims to investigate stadium data quality across different sports and in different regions around the world.
References
- GISGeography (2019). GPS Accuracy: HDOP, PDOP, GDOP, Multipath & the Atmosphere. Retrieved June 17, 2020, available: https://gisgeography.com/gps-accuracy-hdop-pdop-gdop-multipath/
- Johnston, R. D., Thornton, H. R., Wade, J. A., Devlin, P., & Duthie, G. M. (2020). The Distribution of Match Activities Relative to the Maximal Mean Intensities in Professional Rugby League and Australian Football, Journal of Strength and Conditioning Research, 1., available: https://doi.org/10.1519/jsc.0000000000003613
- European Union Agency for the Space Programme (2019). Galileo and EGNOS featured at InterGeo 2019. Retrieved June 17, 2020, available: https://www.gsa.europa.eu/newsroom/news/galileo-and-egnos-featured-intergeo-2019
Author Details
Ruth Montgomery
Account Manager